Contents
Scroll to:
https://doi.org/10.23947/2687-1653-2023-23-3-241-256
Scroll to:
Introduction. In recent years, one of the main trends in the field of testing road structures has become field study of their large-scale models at the accelerated load facility (ALF). It can significantly reduce the cost of selecting the most economical and durable pavement designs. However, the results obtained on the ALF are often relative, since they practically do not correlate with the results of laboratory and field tests on real objects. This study is aimed at a comprehensive investigation of the response of a road structure to a dynamic load, the establishment of patterns of fatigue failure of asphalt concrete layers during the accelerated testing and full-scale tests on real objects.
Materials and Methods. During testing, an accelerated load facility was used, located on the territory of the ShanDong Transport University. When conducting field tests, a dynamic loading unit with a falling weight FWD Primax 1500 was used, which recorded the deflection bowl on the surface of the structure under study. To record the dynamic response in the arrangement of the road structure, a complex of strain gauge sensors was used, which made it possible to register both compressive stresses and tensile strains in different layers. The results obtained under natural conditions were compared to the results obtained on the mathematical FEM model.
Results. The research results have shown that the thickness of the lower coating layer is the main factor affecting the amount of vertical deformation of the pavement, which must be taken into account at the design stage of the pavement structure. Thus, with a thickness of the upper layer of the base of 10 cm, the vertical deformation was 100 µm, and with a thickness of 20 cm – 55 µm, provided that the overall strength of the structure was ensured. The number of load application cycles on the ALF had a minimal effect on the selected asphalt concrete samples during split tensile tests.
Discussion and Conclusion. The adequacy of the results obtained in the course of accelerated testing of road structures was shown through a comprehensive comparison of numerical simulation data and full-scale tests, and the adequacy of the applied calculation methods was validated. The results of the study can be further applied in the road industry to develop and improve the regulatory framework for the design of non-rigid pavement under conditions of increased loads and heavy traffic.
Guangcong N., Tiraturyan A.N., Uglova E.V., Vorobev A.V. Study on Dynamic Response Characteristics of Different Asphalt Pavement Structures Based on ALF Test. Advanced Engineering Research (Rostov-on-Don). 2023;23(3):241-256. https://doi.org/10.23947/2687-1653-2023-23-3-241-256
Introduction. Fatigue damage is one of the main forms of damage to exploited asphalt concrete pavements [1][2]. As a rule, it is associated with alternating loading from the intense multi-cycle impact of the traffic flow. This type of destruction is characteristic of highways all over the world and is one of the challenges to which road scientists are trying to respond. One of the priorities of modern research in the field of fatigue failure forecasting is the testing of road structures at the accelerated load facilities. A certain contribution to the solution of this problem was made by Chinese scientists who analyzed the law of variation in the elasticity modulus of the asphalt concrete layer and its deformation during accelerated loading [3][4]. The mechanism of destruction and fatigue characteristics of asphalt concrete mixture during operation were investigated in [5]. Its authors obtained a correction factor that took into account the difference in the mechanisms of deformation of the road structure under the influence of a test load on accelerated testing installations and during real field tests.
In general, it should be noted that, despite the sufficiently effective simulation of the passage of single loads from the traffic flow, reproduced on ALF, difficulties arise with modeling the load distribution over the width of the carriageway, under environmental conditions, soil-geological conditions, etc. Thus, the test results at ALF cannot be directly used to assess the fatigue characteristics of the actual road surface. They require additional validation under real conditions.
The authors [6–8] studied the responses of road structures to the dynamic impact of the test load, compared and analyzed their changes. The researchers applied methods combining real-time visual observation, instrumental tests for deflection, and fatigue failure resistance during loading, and also carried out work to establish relationships between stresses, deformations in the pavement structure and the temperature of various pavement structures.
It should also be noted that similar studies are being conducted in other countries, besides the PR China, including the Russian Federation, European countries, and the USA. The results of active research aimed at comparing laboratory loading modes to the loading modes corresponding to real road conditions were considered in [9–11]. At the same time, there are no similar comparisons of the results of field and laboratory studies to the results obtained on large-scale models in a controlled experiment. The results of experimental studies in the field of predicting fatigue failure of asphalt concrete layers were given in [12–14]. They comprehensively considered the issues of determining the empirical coefficients required to predict the fatigue failure of asphalt concrete layers according to field visual observations, as well as standard methods of testing asphalt concrete for fatigue when applying a four-point load or indirect stretching. However, the issues of research on large-scale models were also not addressed in them. A number of works deal directly with large-scale modeling, but for roadway paving of different designs [15–17]. The comparison of equal-strength structures to different layers and their thicknesses is the most interesting from a research point of view, since it will provide establishing patterns in the processes of deformation of asphalt concrete associated with its fatigue failure.
Materials and Methods. Accelerated Load Facility. The Accelerated Load Facility (ALF) is located on the territory of ShanDong Transport University. It is a set of equipment for complex testing of road structures (Fig. 1). At the moment, it is one of the modeling methods closest to the real conditions for reproducing a moving transport load. ALF is used to study the characteristics of asphalt concrete coatings under plastic deformations, fatigue cracking and downward cracking. On the ALF, the axle load and the speed of its movement can be adjusted, which provides the best of all types of test equipment compliance with real deformation conditions.
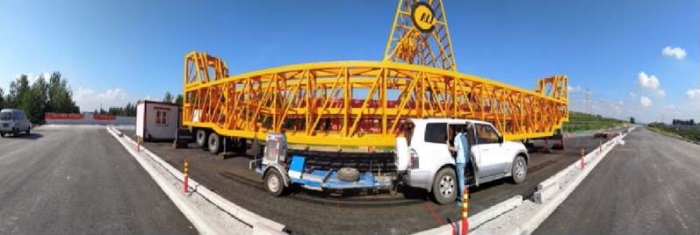
Fig. 1. Accelerated Load Facility [8]
Three typical designs of the roadway paving for the device on the test track were selected to study the fatigue resistance of asphalt concrete mixtures while in operation and pavement defects in different regions. The test section of the road is 12 m long and 4 m wide. The road structure is a working layer of the soil of the roadbed, reinforced with cement, with a coating of three different types of asphalt concrete: S1, S2, and S3, respectively (Fig. 2). The calculated load reproduced by the ALF system is a semi-axial load transmitted through two wheels — BZZ-100. The reproducible load range is
80-200 kN, the load step is 20 kN, the time interval between load applications is 9 s.
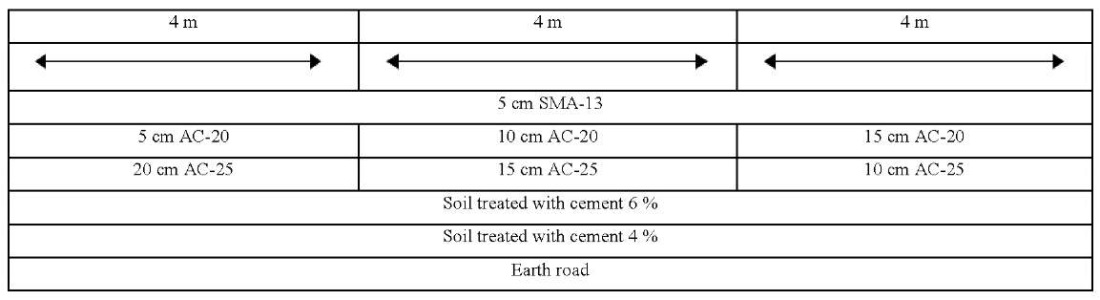
Fig. 2. Road structure at the test road section
A set of equipment was assembled from soil pressure, deformation and temperature sensors installed parallel and perpendicular to the direction of loading to provide real-time monitoring of the dynamic response of the structure during the construction of the test section of the road (Fig. 3, 4). In the lower part of the monolithic asphalt concrete layer there were four sensors of horizontal and longitudinal deformation (Fig. 5). The data collection channel of the corresponding sensor and its location are indicated in Table 1. This arrangement of equipment was validated by world experience in monitoring the stress-strain state (SSS) of road structures and was described in [18–19].
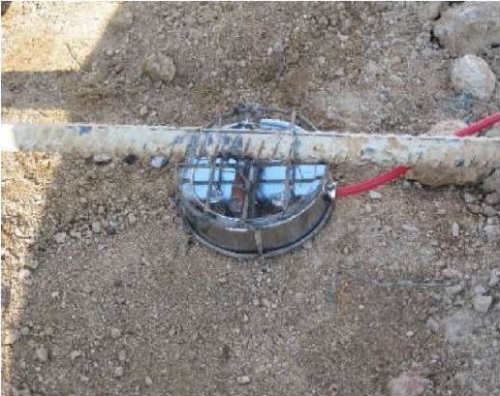
Fig. 3. Sensor for registering pressure in the soil
and on the surface of the base layers [18]
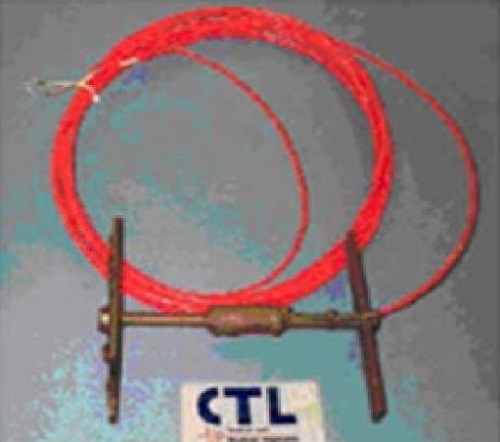
Fig. 4. Sensor for recording relative tensile strain [18]
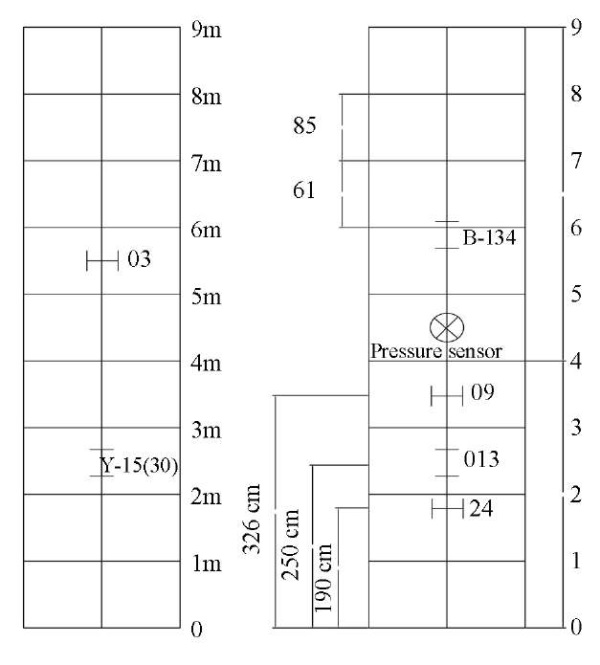
Fig. 5. The depth of each sensor
Table 1
Sensor number and location
|
No. |
Model |
Location |
|
W1 |
B-134 |
6 m |
|
W2 |
013 |
2.5 m |
|
W3 |
24 |
2 m |
|
W4 |
09 |
3.2 m |
|
W5 |
Y-15 |
2.5 m |
|
W6 |
03 |
5.5 m |
|
F1 |
Soil pressure sensor |
4.5 m |
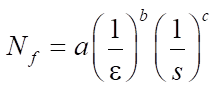
To register the dynamic response on the surface of the road structure, in addition to the ALF, a dynamic loading unit with a falling load FWD PRIMAX 1500 was used. This unit is a pulse dynamic meter of surface movements of the coating, which provides determining the history of movements on the pavement surface under impact by means of installed geophone sensors (Fig. 6). Studies have shown that FWD can be used to determine the elastic modulus of pavement layers during testing at the ALF [20]. In the course of the research, measurements with the FWD were carried out every time after 70,000 cycles on the ALF. The measurement scheme is shown in Figure 7.

Fig. 6. Falling Weight Deflectometer (FWD) [20]
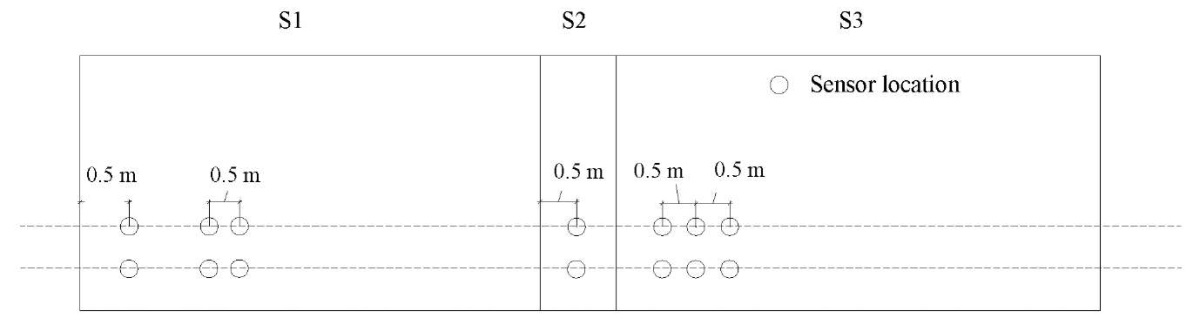
Fig. 7. Schematic diagram of measurements by the FWD
Split Tensile Tests. To obtain comparable results within the framework of this study, laboratory tests for fatigue durability were carried out at the MTS asphalt concrete testing facility [21–24] (Fig. 8). The tests were performed on asphalt concrete samples selected from the accelerated testing site in accordance with the PR China standard — JTG E20-20111. When testing asphalt concrete for splitting, the temperature was 15 ℃, the loading speed was 50 mm/min. Each type of asphalt concrete mix was subjected to four parallel tests. When tested for fatigue durability under controlled voltage conditions, the waveform was half-sinusoid with a frequency of 10 Hz. The complete destruction of the sample was taken as the criterion of destruction. Each test was carried out for three stress levels and three samples of asphalt concrete mix.
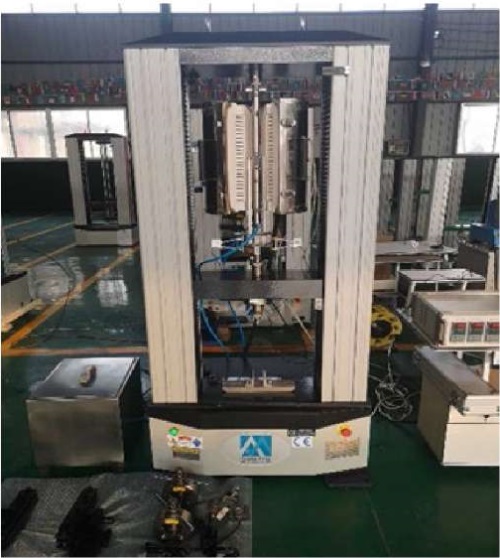
Fig. 8. Installation of a material testing system [21]
Research Results. The temperature condition of the road structure operation at the accelerated testing section. Temperature sensors were mounted in the test structures of the roadway paving at a depth of 0.2 and 6 cm from the road surface, respectively (Fig. 9).
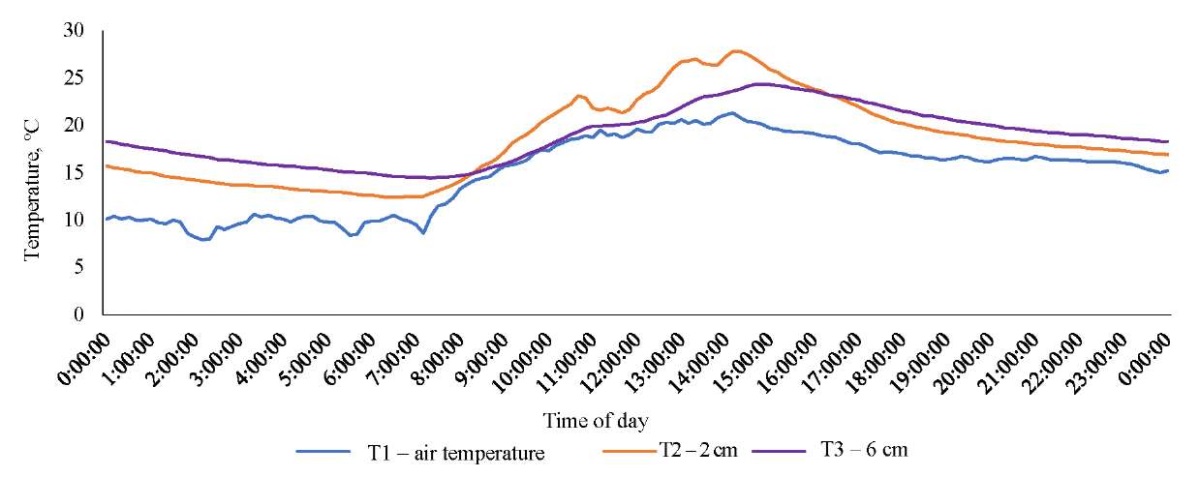
Fig. 9. Temperature variation diagram of asphalt concrete layers at different depths
Automatic data collection was carried out every 15 minutes. Figure 9 shows the curve of temperature variation at different depths of the pavement structure. It can be seen that the temperature here changes together with the change in ambient temperature. The temperature at a depth of 2 cm from the coating surface is almost during the entire observation period above the air temperature and the temperature at a depth of 6 cm.
Analysis of temperature, stresses and deformations in the lower layer of asphalt concrete. During the tests at the ALF, data on tensile deformations at the lower boundary of the lower asphalt concrete layer were collected during each test day. To provide the accuracy and reliability of the deformation data, its registration was carried out using a channel with a transmission frequency of 2,000 Hz and continuous recording of the response lasting at least three minutes, with the possibility of parallel recording of temperature information.
The maximum number of cycles before the appearance of fatigue cracks during testing at the ALF was 420,000 load applications. At the same time, it was found that temperature had the greatest effect on tensile deformations in the range from 140,000 to 240,000 applications, as can be seen from the data presented in Figures 10 and 11.
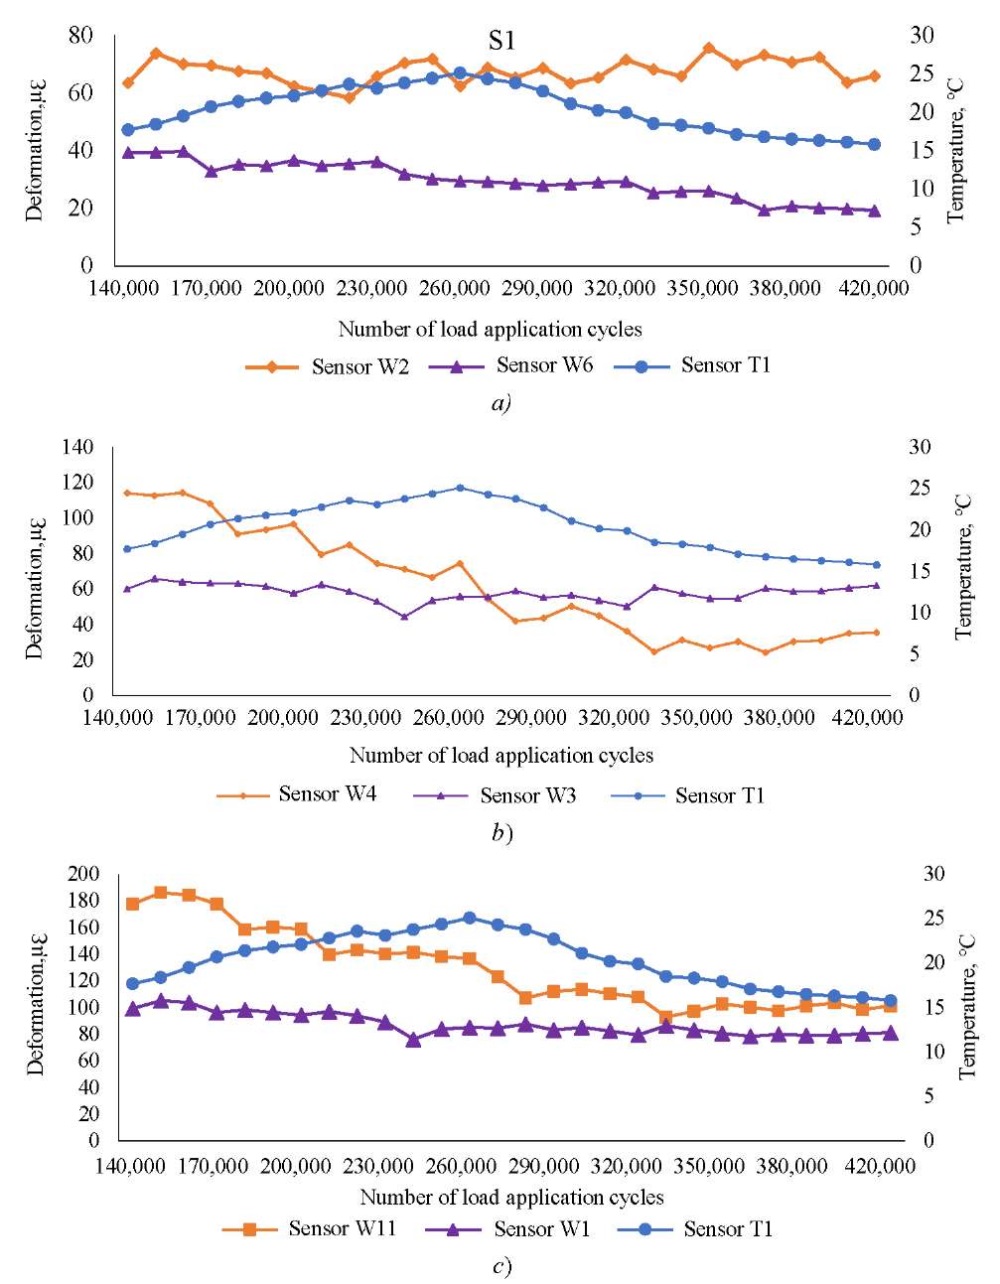
Fig. 10. Strain curve depending on the temperature
on the lower face of the lower coating layer
and the upper coating layer at different loading times:
a — structure S1;
b — structure S2;
c — structure S3
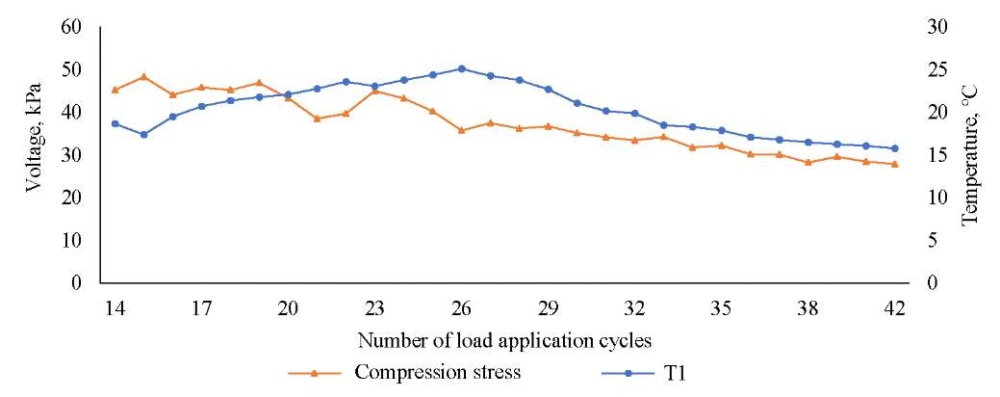
Fig. 11. Maximum stress value change curve in the lower layer of the coating
depending on the temperature at different loading times
As can be seen in Figures 10 and 11, the deformation of various layers of the pavement changed depending on temperature at different loading times: in S1 structure, the tensile deformation in the lower part of the upper layer of the pavement was 19.3–39.7 µε, and the deformation at the lower boundary of the lower layer of asphalt concrete ranged from 58.3 to 75.6 µε. In S2 structure, the range of deformation variation at the lower boundary of the upper coating layer was 42.5–64.8 µε, the deformation range of the lower layer of asphalt concrete was 59.2–115.37 µε. Tensile and compressive deformations at the lower boundary of the lower coating layer gradually decreased with increasing loading time and strongly depended on temperature. Changes on the lower face of the lower layer of asphalt concrete were not obvious. In S3 structure, the deformation range in the lower part of the upper coating layer was 76.2–105.2 µε, the deformation range on the lower face of the lower layer of asphalt concrete was 92.8–186.2 µε. Tensile deformation of the lower coating layer was mainly independent of temperature.
The range of changes in compressive stress at the upper boundary of the base layer was 30.2–48.3 kPa; as the number of loads increased, the change in compressive stress had a high correlation with the trend of temperature change.
Analysis of FWD impact test results. The FWD was used, first of all, to determine the actual values of the elastic modulus of the layers of the road structure and their variation under testing by the ALF in accordance with the backcalculation methodology [25].
A total of six tests were carried out by the FWD. At each test point, measurements were carried out three times at the same load. Then, the average deflection value at the central loading point for the last two impacts was used as a characteristic displacement. The curves of vertical displacement variation at the point of load application depending on the number of cycles of application of the load during accelerated tests are shown in Figure 12.
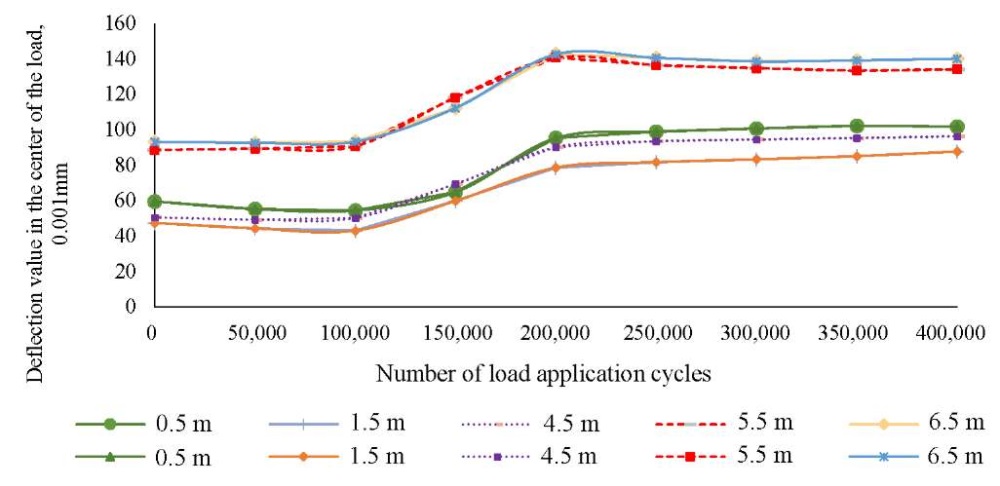
Fig. 12. Deviation curve of various pavement structures depending on the load time
The deflection value in the center of the load application by the FWD gradually grew with increasing number of loads (Fig. 12). Depending on the temperature and loading time during the first 100,000 load cycles, the change in the deflection value was insignificant. The largest change in the magnitude of vertical displacement was observed in the range from 100,000 to 200,000 load applications. After 200,000 load applications, the vertical movement stabilized. Since the pavement structure was affected by temperature and load time, the structural strength of the pavement decreased accordingly, and the amount of vertical displacement increased.
To verify the results of determining the elastic modulus of asphalt concrete layers using the backcalculation technique based on the results of testing by the FWD, additional laboratory examination of asphalt concrete samples was carried out2. As a rule, the actual dynamic modulus of elasticity was reduced to a standard value measured at a temperature of 2 °С according to formula 1:
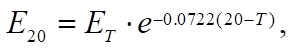 (1)
(1)
where E20 — inversely calculated module of the asphalt concrete layer at 20 °С, MPa; ET — inversely calculated elastic modulus of the asphalt concrete layer at the actual temperature, MPa; T — temperature, °C.
Figure 13 shows the results of determining the elastic modulus of the asphalt concrete base layer depending on the number of load cycles reproduced during the accelerated testing.
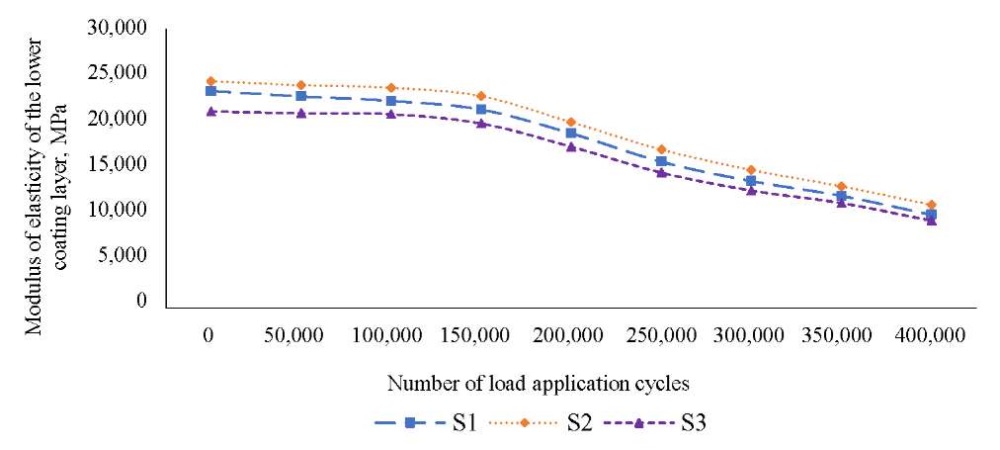
Fig. 13. Variation of dynamic modulus of elasticity of the lower layer of asphalt concrete
depending on the number of loading cycles
Figure 13 shows that as the number of load applications increased, the module of the lower layer of asphalt concrete of various pavement structures tended to decrease. At the initial stage of the test, 0–100,000 load applications (the standard total calculated axle load was 0–25.6 mln applications), the elastic modulus of the lower layer of asphalt concrete slowly decreased with an increase in the number of load applications (the average decrease was 5.23 %). When the number of load applications exceeded 100,000, the rate of reduction of the elastic modulus of the lower layer of asphalt concrete increased significantly. The modulus of elasticity of the lower layer of asphalt concrete of all structures decreased by an average of 54.87 %.
Split tensile test analysis. As the results of accelerated testing showed, fatigue cracks began to appear by about 350,000 load application cycle. When the load reached 420,000 applications, fatigue cracks were observed on the surface layer of asphalt concrete with an opening width of up to 2 mm, and the test was stopped.
When sampling cores at the locations of cracks, it was found that cracks, as a rule, appeared on the surface of the coating, and did not penetrate into the layers. Most of them were transverse, passing through the rolling bands of the wheel load, and only a small part could be attributed to downward fatigue cracks. According to the results of laboratory tests of asphalt concrete samples selected at the accelerated testing sections, the dependence of the split strength on the number of cycles of the applied load was established.
Figure 14 shows that the tensile strength during the splitting of asphalt concrete mixtures under operation, subjected to different accelerated loading times, changed little. In general, the effect of accelerated loading on the tensile strength during the splitting of the asphalt concrete mixture under operation was insignificant.
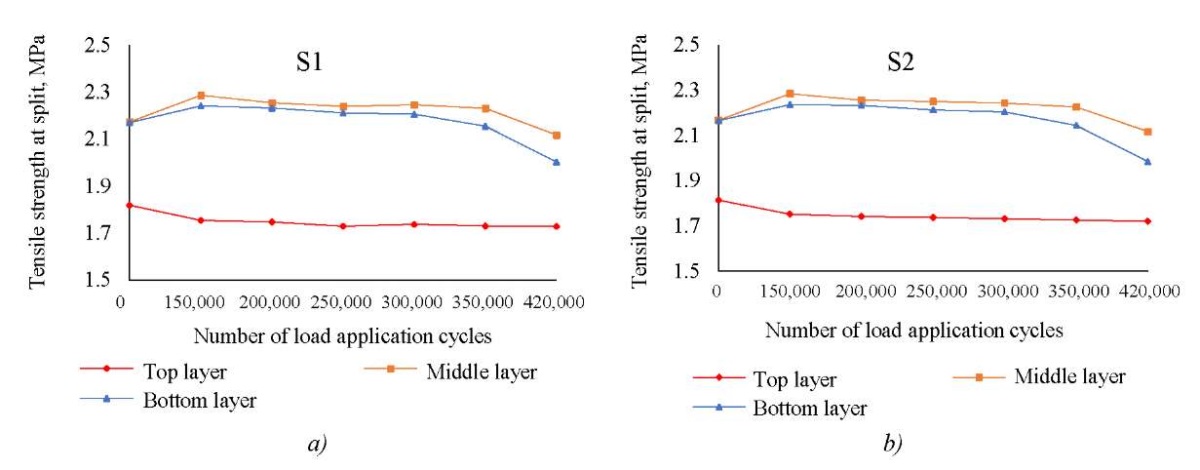
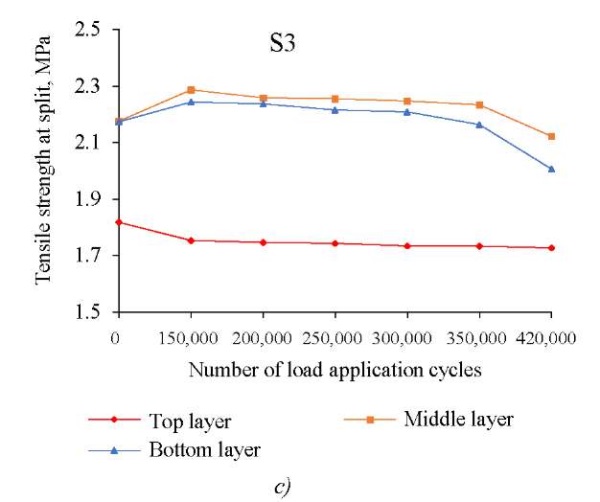
Fig. 14. Strength limit for indirect stretching of asphalt concrete mixtures under operation:
a — structure S1;
b — structure S2;
c — structure S3
Determination of the estimated number of asphalt concrete cycles to failure. At the end of this study, in accordance with the regulatory document of the People's Republic of China JTG D50-2017 “Specifications for Design of Highway Asphalt Pavement”3 and based on the data got by the authors of this study, using the regression analysis method, dependence (2) was obtained for predicting the maximum number of cycles before the onset of fatigue failure. To take into account the influence of the thickness of the asphalt concrete layer package using the regression analysis method and based on the data obtained during accelerated tests, the dependence for the assignment of the correction factor was determined. It is shown in Figure 15.
 (2)
(2)
 (3)
(3)
where Nf — number of loading cycles on the actual structure of the roadway paving, cycles; Nalf — number of loading cycles on the ALF, cycles; et — tensile strain ratio on the lower face of the asphalt concrete layer, µmε; E — elastic modulus of asphalt concrete layer, MPa; C1 — correction factor between laboratory values and values obtained at a full-scale ALF.
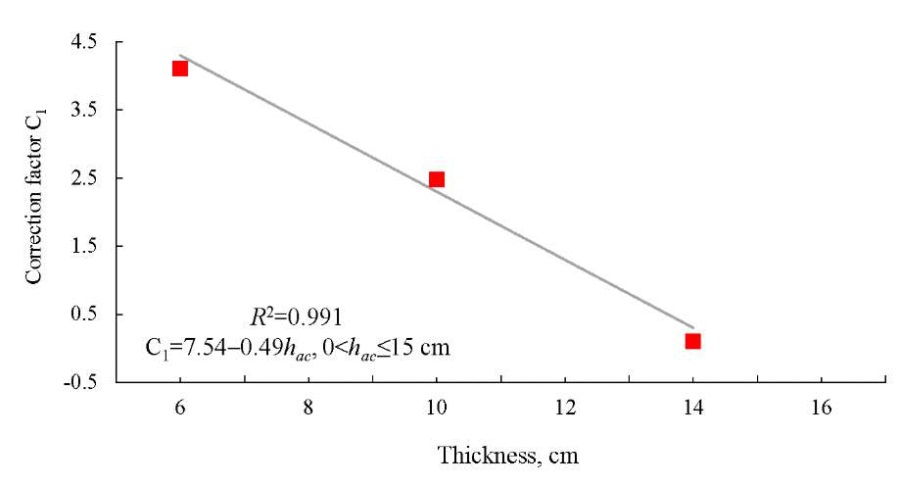
Fig. 15. Relationship between the ALF correction factor
and the thickness of the asphalt concrete layer
The dependence structure corresponds to the general view obtained by the Asphalt institute [14]:
 , (4)
, (4)
where a, b, c — empirical coefficients determined under laboratory or field tests; e — ultimate deformation at which the tests are carried out; S — material stiffness parameter.
Analysis of mechanical response characteristics. In JTG D50-2017 “Specifications for Design of Highway Asphalt Pavement”, the parameter of fatigue cracking of the bottom layer of asphalt concrete is one of the calculated indicators adopted in the design. Due to the greater rigidity of the bottom layer of asphalt concrete, the greatest tensile deformations are concentrated at its lower boundary, which is confirmed by the results given in this article. In the framework of a numerical experiment, S3 structure is considered as a key control structure for calculating the tensile strain in the lower part of the asphalt concrete pavement. The design scheme of the pavement adopted in the simulation is shown in Figure 16.
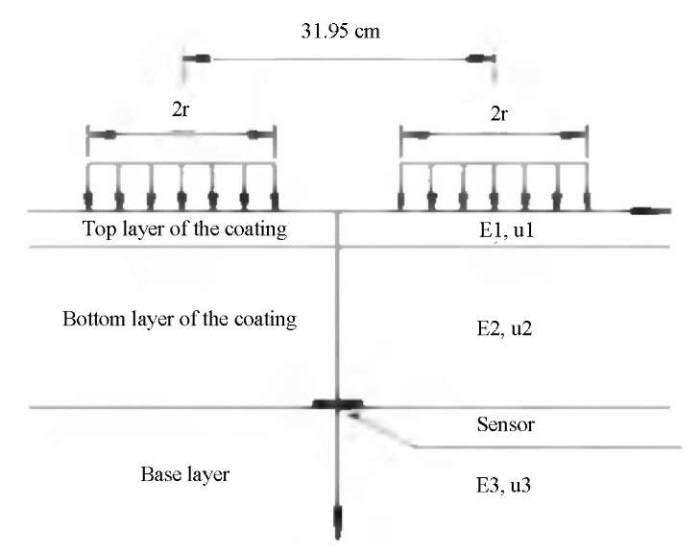
Fig. 16. Mechanical response calculation model according to JTG D50-2017
The calculation of the structure response was carried out on a finite element model of the road structure, while the hypothesis of complete adhesion between all structural layers of the pavement was accepted. The calculation was performed for a paired wheel of a motor vehicle with an axle load of 200 kN and a pressure of 1.1 Mpa [25–27]. When substituting into the mathematical model, the elastic modules of the pavement layers were used as input data, calculated according to the test results by the FWD. The results of comparing the road structure response registered during accelerated tests and calculated using the finite element method (FEM) are shown in Figure 17.
Fig. 17. Comparison of measured and calculated values
of the response to deformation of the bottom layer of S3 coating
Judging by the data in Figure 17, due to the influence of ambient temperature and the thickness of the bottom layer of asphalt concrete, the calculated value of deformation in the lower part is slightly less than the measured value of deformation. However, this can be explained by a number of simplifications adopted in the mathematical model. In general, the results of full-scale tests and numerical modeling are quite close and are characterized by similar trends, which indicates the adequacy of both the full-scale testing and the applied methods of numerical modeling.
Discussion and Conclusion. One of the basic results presented in this article and differing from the results of previous studies [3–8][14][19][20] is the conclusion about the prevailing influence of the thickness of the top layer of the base on the amount of the vertical elastic deformation recorded on the surface of the road structure. It was validated by a set of experimental measurements using a dynamic loading unit with FWD Primax 1500. In similar works, it was noted that the combined effect of the thickness of the bottom coating layer and the top base layer had the greatest effect on the amount of elastic deflection on the surface.
Also, within the framework of this study, a comprehensive analysis of the test results at the ALF and numerical experiments based on known models for predicting fatigue failures was carried out. As a result, dependences (2) and (3) were obtained to implement the transition and provide comparability of this outcome. It should be noted that the coefficients obtained in the course of this work for dependence (2) differ from similar values known to us obtained at the MnRoad test site [14] (Fig. 18).
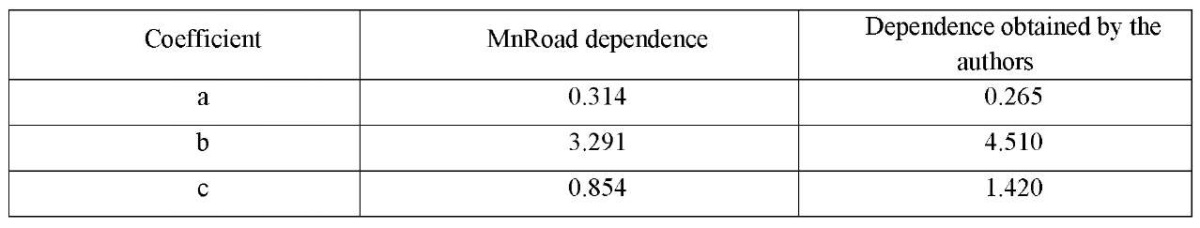
Fig. 18. MnRoad dependence coefficients and those obtained by the authors
Differences in coefficients are largely due to differences in the rules for the selection of asphalt concrete mixtures, as well as regional testing conditions. It should also be noted that these coefficients somewhat tighten the classical performance model, reducing the predicted service life of road clothes, in comparison to the MnRoad model.
Undoubtedly, these results were obtained for a fairly limited sample of experiments and a set of materials according to their physical and mechanical properties. They meet the requirements for asphalt concrete mixtures used in the construction of highways in China, and are quite close to the mixtures used in the Russian Federation. At the same time, it seems promising to use the results obtained. In the future, investigation on calibration of the dependence will be continued taking into account data from test sections of operated highways in the Russian Federation and China.
Laboratory checkout has shown that the split tensile strength practically does not depend on the number of loading cycles of the tested asphalt concrete during accelerated testing.
The results obtained can be applied for further development and improvement of the legal framework of the road industry regulating methods of calculation and prediction of fatigue cracking.
1. Ministry of Transport of the People's Republic of China. JTG E20-2011 “Test Regulations of Asphalt and Asphalt Mixture for Highway Engineering” JTG E20-2011 English PDF (JTGE20-2011). (chinesestandard.net) [S].
2. AASHTO TP 62-2007 Standard Method of Test for Determining the Percentage of Fracture in Coarse Aggregate [S].(D 5821 – 01 (kashanu.ac.ir))
3. Ministry of Transport of the People's Republic of China. JTG D50-2017 “Specifications for Design of Highway Asphalt Pavement. Ministry of Transport” [S]. 2017. (JTG D50-2017 English PDF (JTGD50-2017) (chinesestandard.net))
1. Ji Xiaoping, Zheng Nanxiang, Niu Sisheng, Meng Shutao, Xu Quanliang. Development of a Rutting Prediction Model for Asphalt Pavements with the Use of an Accelerated Loading Facility. Road Materials and Pavement Design. 2015;17(1):1–17. https://doi.org/10.1080/14680629.2015.1055337
2. Insoo Yeo, Youngchan Suh, Sungho Mun. Development of Remaining Fatigue Life Model for Asphalt Black Base through Accelerated Pavement Testing. Construction and Building Materials. 2008;22(8):1881–1886. https://doi.org/10.1016/j.conbuildmat.2007.04.015
3. Chen Shao Xing, Wei Xin Ren. Study Fatigue Performance Predict Model of Asphalt Layer Basement on Accelerated Loading Test. Advanced Materials Research. 2011;255–260:3238–3243. https://doi.org/10.4028/www.scientific.net/AMR.255-260.3238
4. Zexin Ma, Li-Ping Liu, L-J Sun. Damage and Failure Performance of In-Service Asphalt Mixture Based on Accelerated Loading Test. Journal of Jilin University. 2019;49(2):384–391. https://doi.org/10.13229/j.cnki.jdxbgxb20171109
5. Shao Xing Chen, Wei Xin Ren. Study Fatigue Performance Predict Model of Asphalt Layer Basement on Accelerated Loading Test. Advanced Materials Research. 2011;255:3238–3243. https://doi.org/10.4028/www.scientific.net/AMR.255-260.3238
6. TRB’s National Cooperative Highway Research Program (NCHRP synthesis 433): Significant Findings from Full Scale Accelerated Pavement Testing . Washington, DC: The National Academies Press; 2012. https://doi.org/10.17226/22699
7. Timm DH, Priest AL, McEwen TV. Design and Instrumentation of the Structural Pavement Experiment at the NCAT Test Track. Auburn AL: National Center for Asphalt Technology; 2004. 89 p. URL: https://rosap.ntl.bts.gov/view/dot/38610 (accessed: 20.07.2023).
8. Ji Xiaoping, Zheng Nanxiang, Hou Yueqin, Niu Sisheng. Application of Asphalt Mixture Shear Strength to Evaluate Pavement Rutting with Accelerated Loading Facility (ALF). Construction and Building Materials. 2013;41:1–8. https://doi.org/10.1016/j.conbuildmat.2012.11.111
9. Uglova E.V., Tiraturyan A.N., Lyapin A.A. Integrated Approach to Studying Characteristics of Dynamic Deformation on Flexible Pavement Surface Using Nondestructive Testing. PNRPU Mechanics Bulletin. 2016;(2):111– 130. https://doi.org/10.15593/perm.mech/2016.2.08
10. Tiraturyan AN, Uglova EV. Assessment of Durability Indicators of Flexible Pavements on the Basis of the Mechanical-Statistical Method. MATEC Web of Conferences. 2018;196:01020. https://doi.org/10.1051/matecconf/201819601020
11. Uglova EV, Tiraturyan AN, Shilo OA. Prediction of Failure Fatigue Accumulation in Asphalt Concrete Layers of Flexible Pavements. Russian Journal of Building Construction and Architecture . 2019;55(3):52–61. https://doi.org/10.25987/VSTU.2019.55.3.006
12. Nithin Sudarsanan, Youngsoo Richard Kim. A Critical Review of the Fatigue Life Prediction of Asphalt Mixtures and Pavements. Journal of Traffic and Transportation Engineering (English Edition). 2022;9(5):808– 835. https://doi.org/10.1016/j.jtte.2022.05.003
13. Sohrab Zarei, Jian Ouyang, Yanqing Zhao. Evaluation of Fatigue Life of Semi-Flexible Pavement with Cement Asphalt Emulsion Pastes. Construction and Building Materials. 2022;349:128797. URL: https://linkinghub.elsevier.com/retrieve/pii/S0950061822024540 (accessed: 22.07.2023).
14. Tanquist B. Local Road Material Properties and Calibration for MnPAVE Summary Report. Saint Paul, MN: Minnesota Department of Transportation; 2008. 43 p. URL: https://www.lrrb.org/media/reports/200856.pdf (accessed: 20.07.2023)
15. Jian Zou, Roque R, Byron T. Effect of HMA Ageing and Potential Healing on Top-down Cracking Using HVS. Road Materials and Pavement Design. 2012;13(3):1–16. https://doi.org/10.1080/14680629.2012.709177
16. Zhen Liu, Xingyu Gu, Hua Ren, Zhou Zhou, Xiang Wang, Shi Tang. Analysis of the Dynamic Responses of Asphalt Pavement Based on Full-Scale Accelerated Testing and Finite Element Simulation. Construction and Building Materials. 2022; 325:126429. https://doi.org/10.1016/j.conbuildmat.2022.126429
17. Ze Jiao Dong, Sheng Long Li, Jia Yu Wen, Hong Chun Chen. Asphalt Pavement Structural Health Monitoring Utilizing FBG Sensors. Advanced Engineering Forum. 2012;5:339–344. https://doi.org/10.4028/www.scientific.net/AEF.5.339
18. Wei Lu, Kayser S, Wellner F. Impact of Surface Temperature on Fatigue Damage in Asphalt Pavement. Journal of Highway and Transportation Research and Development (English Edition). 2013;7(3):1–6. https://doi.org/10.1061/JHTRCQ.0000324
19. Lin Wang, Jincheng Wei, Wenjuan Wu, Xiaomeng Zhang, Xizhong Xu, Xiangpeng Yan. Technical Development and Long-Term Performance Observations of Long-Life Asphalt Pavement: A Case Study of Shandong Province. Journal of Road Engineering. 2022;2(4):369–389. https://doi.org/10.1016/j.jreng.2022.11.001
20. Jinting Wu, Fen Ye, Yinting Wu. Modulus Evolution of Asphalt Pavement Based on Full-Scale Accelerated Pavement Testing with Mobile Load Simulator. International Journal of Pavement Engineering. 2014;16(7):1–11. https://doi.org/10.1080/10298436.2014.943213
21. Yong Pen, Lijun Sun, Yongjiu Shi. Factors Affecting the Splitting Strength of Asphalt Mixture. Journal of Jilin University: Engineering Edition. 2007;37(6):1304-1307. URL: https://www.researchgate.net/publication/290298136_Factors_affecting_splitting_strength_of_asphalt_mixture (accessed: 20.07.2023).
22. Lu Xue-yuan, Sun Li-jun. Factors Affecting Splitting Strength for AC-13 Modified Asphalt Mixture and Marshall Performance Standard Correlation. Journal of Jilin University: Engineering Edition. 2010;40(03):676−682. URL: http://xuebao.jlu.edu.cn/gxb/EN/abstract/abstract10100.shtml (accessed: 20.07.2023).
23. Yong Chun Qin, Sui Yuan Wang, Wei Zeng, Xiao Pei Shi, Jian Xu, Song Chang Huang. The Effect of Asphalt Binder Aging on Fatigue Performance of Evotherm WMA. Advanced Materials Research. 2012;535-537:1686–1692. https://doi.org/10.4028/www.scientific.net/AMR.535-537.1686
24. Castro M, Sánchez JA. Estimation of Asphalt Concrete Fatigue Curves – A Damage Theory Approach. Construction and Building Materials. 2008;22(6):1232–1238.
25. Uglova EV, Tiraturyan AN. Interlayer Bond Evaluation in the Flexible Pavement Structures Using a Nondestructive Testing Method. Procedia Engineering. 2016;150:1791–1796. https://doi.org/10.1016/j.proeng.2016.07.172
26. Nazarian S, Alvarado G. Impact of Temperature Gradient on Modulus of Asphaltic Concrete Layers. Journal of Materials in Civil Engineering. 2006;18(4):492–499. https://doi.org/10.1061/(ASCE)0899-1561(2006)18:4(492)
27. Shuhua Wu, Huaxin Chen, Jiupeng Zhang, Zhonghua Zhang. Effects of Interlayer Bonding Conditions between Semi-Rigid Base Layer and Asphalt Layer on Mechanical Responses of Asphalt Pavement Structure. International Journal of Pavement Research and Technology. 2017;10(3):274–281. https://doi.org/10.1016/j.ijprt.2017.02.003
Ni Guangcong, Engineer of the Department of Civil Engineering and Architecture
5001, Haitang Road, Jinan City, Shandong Province, 250023
Artem N. Tiraturyan, Dr.Sci. (Eng.), Associate Professor, Professor of the Motorways Department
1, Gagarin sq., Rostov-on-Don, 344003
Evgeniya V. Uglova, Dr.Sci. (Eng.), Professor of the Motorways Department
1, Gagarin sq., Rostov-on-Don, 344003
Andrey V. Vorobev, Engineer of the Motorways Department
1, Gagarin sq., Rostov-on-Don, 344003
Guangcong N., Tiraturyan A.N., Uglova E.V., Vorobev A.V. Study on Dynamic Response Characteristics of Different Asphalt Pavement Structures Based on ALF Test. Advanced Engineering Research (Rostov-on-Don). 2023;23(3):241-256. https://doi.org/10.23947/2687-1653-2023-23-3-241-256


Advanced Engineering Research (Rostov-on-Don)
ISSN 2687-1653 (Online)
Contact with: Publisher / Editorial Office of the Journal
Publisher: Don State Technical University - DSTU, Rostov-on-Don, Russia - https://donstu.ru/en/
Editor-in-Chief: Alexey N. Beskopylny, Dr.Sci. (Eng.), Professor, Vice-Rector, Don State Technical University (Rostov-on-Don, Russia)
Don State Technical University
1, Gagarin Sq., Rostov-on-Don, 344003, Russia
tel.: +7 (863) 2738-372, e-mail: vestnik@donstu.ru
16+
Processing of personal data