Contents
Scroll to:
https://doi.org/10.23947/2687-1653-2023-23-4-422-432
EDN: RBUFLG
Scroll to:
Introduction. The analysis and interpretation of hydrodynamic research data are based on theoretical models and computational algorithms. Despite the demand for this topic, numerous issues related to unsteady fluid flows in oil reservoirs still require solutions. Therefore, mathematical setting of problems related to the account of unsteady fluid flow, the development of effective numerical methods and algorithms, their solution using modern web technologies are pressing. This study is aimed at developing a web application for mathematical modeling of the process of fluid filtration in single- porosity reservoirs when conducting a hydrodynamic study at a production well.
Materials and Methods. To solve the problem, the methods of continuum mechanics and computational mathematics were applied. A model of oil flow in a single-porosity reservoir was presented. Python and JavaScript programming languages were used in the development of the application. The calculation results were stored in a relational database implemented using PostgreSQL tools.
Results. A new web application has been developed for modeling the oil filtration process in single- porosity reservoirs. It is applicable for studying fluid dynamic processes and can be used to predict flowrates, production and calculation of optimal well operation modes.
Discussion and Conclusion. The developed web application provides for building pressure and temperature fields in the reservoir near a flowing and shut-in production well and at various distances from it. This information makes it possible to urgently assess the duration of hydrodynamic studies, as well as to regulate the operation of wells. The application can be deployed in an existing network infrastructure and use all the functionality by connecting to a remote server. It is optimized for use on various platforms and has broad prospects for further development.
Mazitov A.A. Web Application for Mathematical Modeling of Unsteady Oil Flow in Porous Medium. Advanced Engineering Research (Rostov-on-Don). 2023;23(4):422-432. https://doi.org/10.23947/2687-1653-2023-23-4-422-432. EDN: RBUFLG
Introduction. The Russian Federation is one of the leading countries in the world in terms of oil production. Every year, over 500 million tons of oil are produced in the country's fields, the vast majority of which is exported in crude form to the countries of the Asia-Pacific region, Europe and the near abroad. The oil industrial growth in our country has an impact on other industries and spheres of activity; therefore, the solution to tasks for the effective development and exploitation of oil fields has been and remains promising. The basis of modern scientific technologies of oil development is a comprehensive study of the properties of productive reservoirs, the substances contained in them, and the complex processes occurring during fluid flow.
The base target in oil production is to increase the rate of drainage from the productive reservoir and maintain reservoir pressure. The planning of work on the effective development and optimal operation of an oil well is of complex character, associated with the hydrodynamic processes occurring during the fluid flow in the “well — formation” system [1]. Hydrodynamic well testing (WT) is used to study the productive properties of reservoirs and fluids. WT means provide for the reservoir data collection using bottomhole or wellhead instruments, as well as the postprocessing of measurements and interpretation of the data obtained (productivity, filtration properties of fluids, type of collector, etc.) [2].
When studying reservoirs through WT, theoretical models based on classical equations and laws are used, as well as computational algorithms for modeling fluid filtration processes. However, despite the demand for this topic, a number of issues related to the mathematical and computational aspects of modeling nonstationary flows in reservoirs require further development [3][4].
There are a number of domestic (“Avton”, “Gidrozond”) and foreign (OLGA, LedaFlow, FlowVision, MAST, Saphir NL) programs for the analysis and interpretation of WT results [5–7]. With all the advantages they have, there are some disadvantages, such as the inability to perform a full range of calculations, viewing and changing the parameters of the original models. All the presented software products are desktop, commercial, difficult to operate, many have an overloaded interface. Under the conditions when it is required to carry out calculations promptly or in real time, large commercial simulators are ineffective. Therefore, to perform similar work, it is proposed to use a web application that has many advantages.
Unlike desktop applications, web applications are independent of the operating system and computing power of personal computers. The program code of a web application is written once for a specific platform where it will be deployed. Web applications attract attention because of their simple implementation, ease of use, and high performance. Their basic characteristics are accessibility, reliability, security, scalability, flexibility, cross-platform character. To work with a web application from a user's personal computer, it is necessary to be on the same network with the server on which it is deployed. Such a network can be a local enterprise network or a global Internet network, if we are talking about websites. Compared to desktop applications, web applications have one drawback — response time, depending on the distance of the personal computer from the server.
The operating logic of a web application differs from a desktop application, which launches and executes code on the user’s computer. Therefore, desktop applications are distinguished by a more advanced and responsive user interface and allow for implementing more complex domain logic. However, with the development of web technologies, this advantage is leveled every year, and web applications are increasingly capable of implementing complex user scenarios. Thus, web applications become more competitive in terms of the implementation of production tasks.
In this regard, the mathematical formulation of problems taking into account the unsteady fluid flow in all its elements (formation, stack pipes, flow channels), the development of effective numerical methods and algorithms, their subsequent solutions using modern web development technologies are important today. The use of the obtained numerical algorithms makes it possible to quantitatively describe the behavior of pressure and temperature in oil wells. The algorithm and web application will provide users, experts in the field of analysis and interpretation of hydrodynamic studies, with a convenient and easily adaptable tool for calculating complex processes occurring under the development of porous reservoirs.
Materials and Methods. A production well is considered, on which a hydrodynamic study is carried out by the build-up test. The well operates a terrigenous reservoir, which belongs to the single-porosity reservoirs. The formation is unconfined, there is no impact of neighboring wells. The fluid flow in the formation is horizontal, there are no crossflows between the layers. The well operates in a steady state with a constant bottomhole pressure. Constant pressure and temperature are maintained at the boundary of the contour. To conduct the investigation, the measuring device is lowered to the depth of the upper perforation holes. The calculation of pressure and temperature dynamics is carried out in the spatial one-dimensional case.
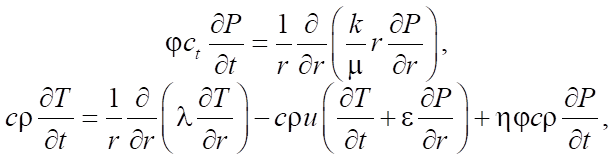
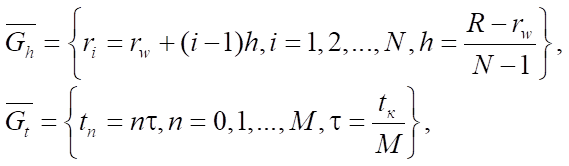
In numerical modeling, it is important to take into account all the parameters of the reservoir and fluid to achieve the most qualitative description of the oil mass transfer process in a single-porosity reservoir. Let us consider a mathematical model describing the process of oil filtration in a single-porosity reservoir. The piezoconductivity and thermal response equations serve as the basis for the model. The mathematical model in radial coordinates is a partial differential system:
 (1)
(1)
where
 — formation porosity;
 — formation compressibility (1/Pa);
 — formation permeability (m²);
 — fluid viscosity (Pa∙s);
 — formation pressure (Pa);
 — distance to the well wall (m);
 — time (s);
 — oil heat capacity (J/kg∙K);
 — oil density (kg/m³);
 — formation temperature (K);
 — thermal conductivity of the porous medium (W/m³∙K);
 — rate of convective heat transfer in a porous medium (m/s);
 — Joule-Thomson coefficient (K/Pa);
 — adiabatic expansion coefficient (K/Pa).
The first equation describes the process of pressure change in the reservoir, the second — the process of heat transfer of fluid.
The rate of convective heat transfer in a porous medium is determined by the expression:
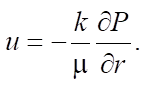 (2)
(2)
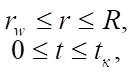
System of equations (1) is given in the space-time interval:
 (3)
(3)
where
 — well radius;
 — distance to the boundary of the contour of the investigation (m);
 — time of the investigation (s).
Based on the above conditions for the well and the considered area for system (1), the initial and boundary conditions are set as follows:
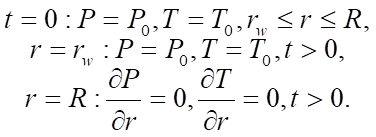 (4)
(4)
After determining the initial and boundary conditions, a model of the oil filtration process in a single–porosity reservoir (1)–(4), was obtained, characterizing the redistribution of pressure and temperature in the formation.
The initial stage of solving the system is to bring it to a discrete form. The finite difference method is used for this purpose [8]. A uniform space-time grid is being constructed:
 (5)
(5)
where
 — grid spacing;
 — grid time step;
 — number of nodes in space;
 — number of nodes by time.
After replacing the differential expressions with difference analogues, a system of equations is obtained:
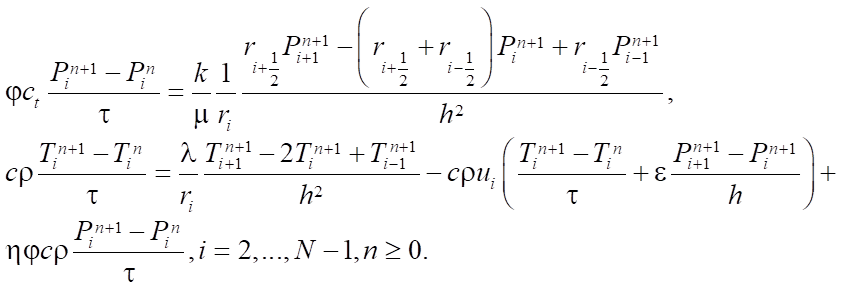 (6)
(6)
System (6) is a system of linear equations (SLE), which is reduced to a three-point equation of the general form:
 (7)
(7)
The coefficients are equal to:
 (8)
(8)
System (7) is solved by the scalar sweep method [9][10]. The problem is non-stationary; therefore, the method is used to determine the spatial distribution of formation pressure and temperature at each time layer [11][12]. The problem is solved sequentially, at the first stage, the equation for pressure is solved, at the second — for temperature.
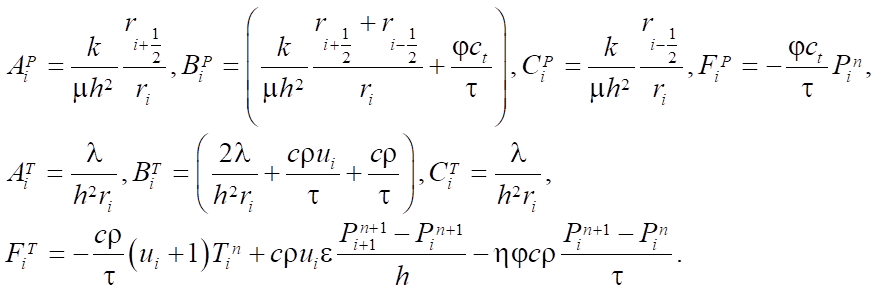
A web application has been developed to automate the solution to the problem. In general, its structure is shown in Figure 1. It identifies five basic components: input information flows, output information flows, information processing methods, hardware, database [13][14].
Fig.1. General application structure
The input information flows are data on the model parameters, and the output data are graphs reflecting the temporal or spatial dependences of bottomhole pressure and temperature. Information processing methods are understood as numerical methods and methods of interpretation of hydrodynamic studies. The hardware is the server on which the application is hosted, and the user's personal computer. A database is used to store input parameters and calculation results.
The final type of the software depends on the means selected for its development. Development tools are paradigms and programming languages, environments and technologies for development. The selection of tools affects the way of the task implementation, the criteria for software quality, the presentation of data, and the type of graphical user interface. To develop the application, Python using the Flask microframework was chosen as the programming language for the server side, and JavaScript with Vue.js — for the client side [15][16]. PostgreSQL was used as a DBMS for database design and development [17].
Research Results. The developed software is a cross-platform client-server web application. Data storage and calculations take place on a web server with which the user interacts through a browser (all modern Internet browsers are supported). The client part can be used on a wide range of platforms (PCs, laptops, smartphones) and operating systems (Windows, MacOS, Android, iOS).
A large part of the web application main window is occupied by a tool for plotting temperature and pressure. The graphs are constructed after the calculation is performed by selecting the appropriate menu item. It is also possible to plot graphs based on previously performed calculations. For this purpose, the required calculation is selected on the left side of the window. Graphs are based on spatial and temporal coordinates. To change the chart view, select the corresponding items in the upper part of the window.
All calculations performed are stored in the developed flowcalcdb relational database, whose structure is shown in Figure 2.
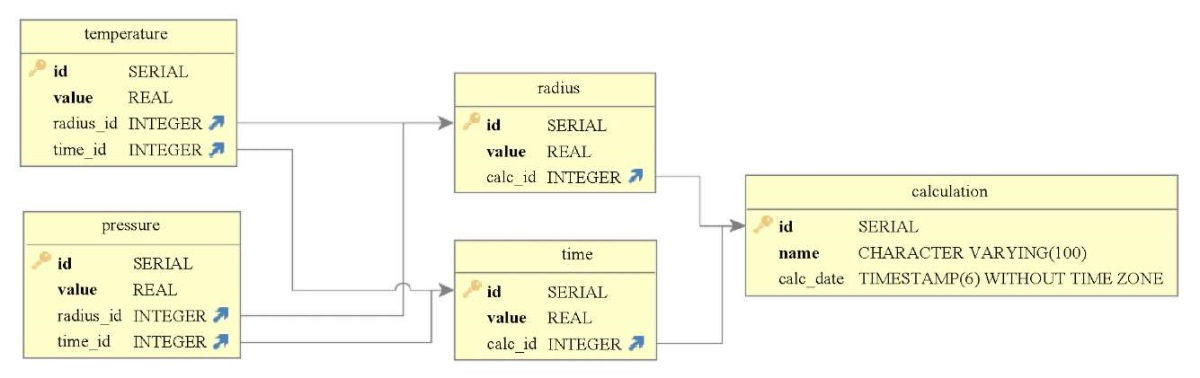
Fig. 2. Structure of the flowcalcdb database
In total, the database contains five tables, which are in the third normal form [18]. All tables have primary keys. The primary table, calculation, stores the name of the calculation and the date of its creation. Two tables dependent on it, radius and time, store information on space-time coordinates. The temperature and pressure tables store the temperature and pressure values, respectively.
A number of computational experiments have been carried out in the developed application to evaluate the result of its work. The values from Table 1 are used for modeling.
Table 1
Initial and boundary conditions, calculation parameters
|
Parameter |
Value |
Measurement unit |
|
Well radius, rw |
0.102 |
m |
|
Radius of investigation, R |
100 |
m |
|
Time of investigation, t |
24 |
h |
|
Initial pressure, P0 |
25 |
MPa |
|
Final pressure, Pк |
30 |
MPa |
|
Permeability, k |
1e-14 |
m² |
|
Porosity |
0.2 |
|
|
Oil viscosity, μ |
1.10e-3 |
Pa∙s |
|
Oil compressibility |
1.58e-9 |
1/Pa |
|
Heat capacity, cρ |
1.4 |
MJ/m³∙K |
|
Thermal conductivity, λ |
0.6 |
W/m∙K |
|
Joule-Thomson coefficient, ε |
3.94e-7 |
K/Pa |
|
Adiabatic expansion coefficient, η |
3.15e-7 |
K/Pa |
|
Initial temperature, T0 |
363.15 |
K |
|
Number of points by time, N |
1,000 |
|
|
Number of points by space, M |
1,000 |
Using the data from Table 1, graphs of the pressure and temperature distribution over space are plotted, shown respectively in Figures 3 and 4.
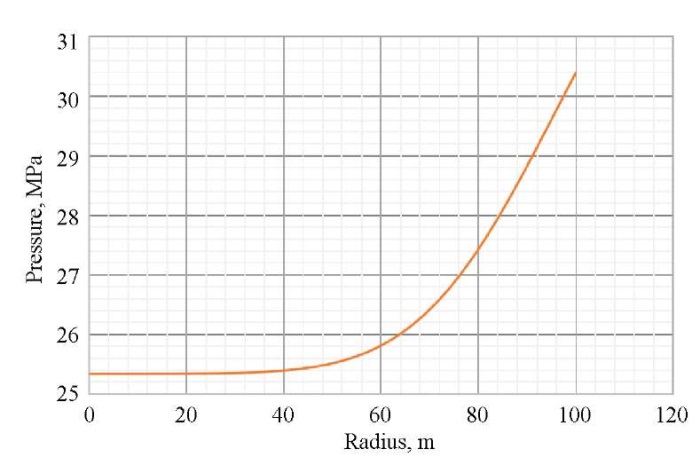
Fig. 3. Distribution of pressure over space at a finite point in time
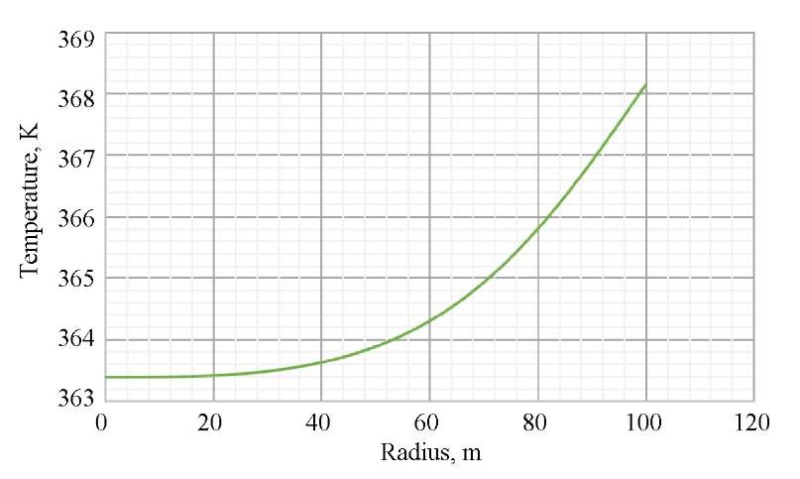
Fig. 4. Distribution of temperature over space at a finite point in time
As follows from the data in Figures 3 and 4, after stopping the well for hydrodynamic examination, pressure and temperature are restored, and the farther away from the walls of the well, the greater the recovery value. Figures 5 and 6 show exactly how pressure and temperature are distributed at different points in time (6, 12, 24 hours) after the well is stopped. This information is useful for experts in the analysis and interpretation of hydrodynamic studies, as it provides for the assessment of the dynamics of pressure and temperature and decision making on continuing or stopping the investigation, as well as carrying out additional measures.
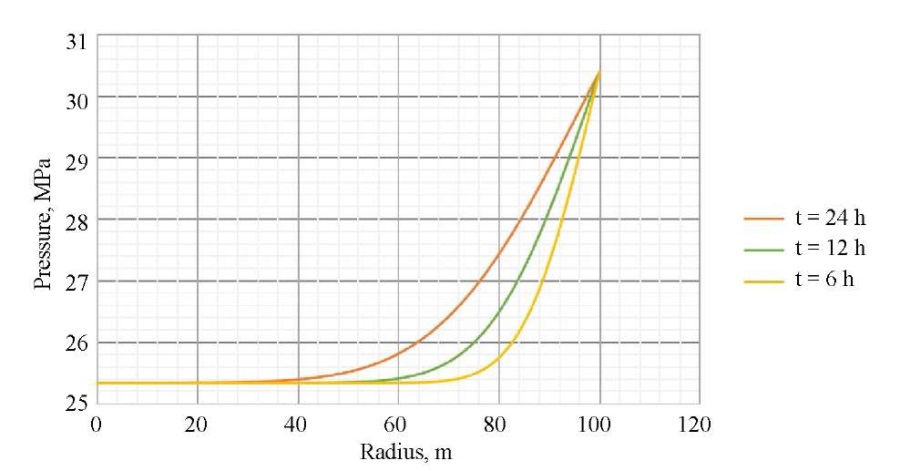
Fig. 5. Distribution of pressure across space at different points in time

Fig. 6. Distribution of temperature across space at different points in time
Based on the calculations performed, it was found that the permeability of the formation had the greatest impact on the behavior of pressure and temperature. Figures 7 and 8 show graphs of pressure and temperature dynamics depending on different permeability values near the walls of the well (low-permeability reservoir — 1 mD, medium-tight reservoir — 10 mD, high-permeability reservoir — 100 mD (1D = 10-12m²)). As can be seen in the graphs, the rate of pressure and temperature recovery grows with increasing reservoir permeability. Figure 7 shows a graph for real field data (reservoir permeability is 80 mD
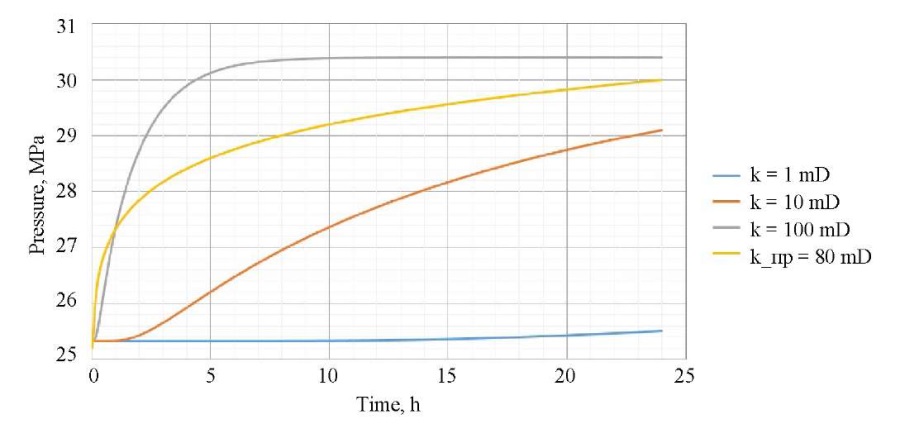
Fig. 7. Pressure dynamics for different permeabilities
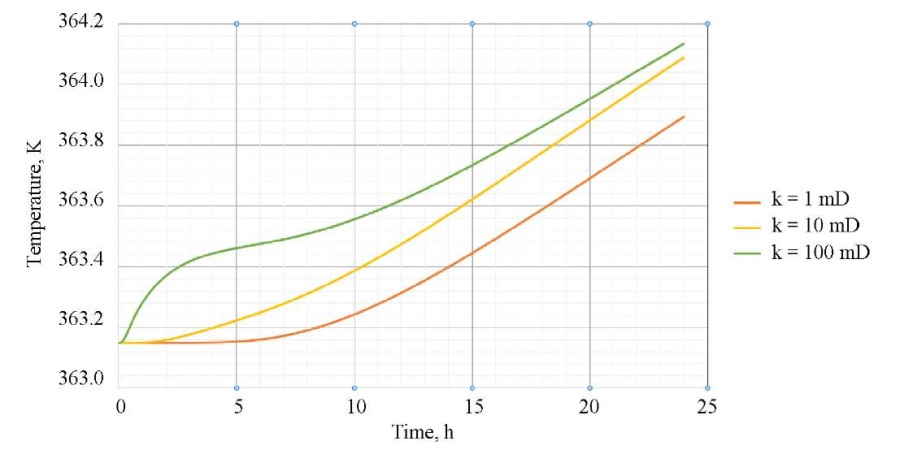
Fig. 8. Temperature dynamics for different permeabilities
Based on the pressure dynamics, it is possible to determine the time of the investigation (Fig. 7). As an example, for a high-permeability reservoir, it makes no sense to conduct an investigation for more than ~6 hours, since after this time the pressure practically does not change, and an idle well is ineffective, since production losses are occurring.
Discussion and Conclusion. The developed web application can be used for the analysis and interpretation of hydrodynamic research data. The web application provides a user-friendly interface and reduces support costs. It can be deployed in an existing network infrastructure or connected to a remote server to provide full functionality. The application allows us to qualitatively and quantitatively assess the behavior of pressure and temperature in single-porosity reservoirs. Storing the calculation results in a database makes it possible to perform an analysis using the results of a variety of studies. On its basis, a summary report can be compiled, and recommendations for further use of the well or field as a whole can be formulated. The models used are stable and convergent. Graphs are built using a written web application, and therefore, it can be used in production.
The application has broad development prospects, specifically, it is possible to implement other models of fluid flow, or provide for the presence of several phases. Also, at the time of writing this work, the issue of abandoning foreign commercial products in favor of domestic simulators has become acute. Therefore, the development of such products is promising.
1. Hussein A. Essentials of Flow Assurance Solids in Oil and Gas Operations: Understanding Fundamentals, Characterization, Prediction, Environmental Safety, and Management, 1st ed. Houston, TX: Gulf Professional Publishing; 2022. 1122 p.
2. Kamartdinov MR, Kulagina TE, Mangazeev PV, Pankov MV. Hydrodynamic Studies of Wells. Moscow: YUKOS; 2003. 810 p. (In Russ.)
3. Bobreneva YuO, Mazitov AA, Gubaydullin IM. Researching the Mechanisms of Fluid Flow in the Fracture-Porous Reservoir Based on Mathematical Modeling. Computational Mathematics and Information Technologies. 2018;2(2):133–143.
4. Bobreneva YuO, Mazitov AA, Gubaydullin IM. Mathematical Modelling of Fluid Flow Processes in the Fracture-Porous Reservoir. Journal of Physics: Conference Series. 2019;1096:012187. https://doi.org/10.1088/1742-6596/1096/1/012187
5. Lisakov SA, Sypin EV, Zyryanova MN, Pavlov AN, Galenko YuA. Modeling the Process of Unsteady Combustion of a Methane-Air Mixture in Coal Mines. Industrial Safety. 2018;(1):40–53. URL: https://tesis.com.ru/infocenter/downloads/flowvision/fv_bti-secna.pdf (accessed: 18.09.2023). (In Russ.)
6. Zhluktov SV, Aksenov AA, Kharchenko SA, Moskalev IV, Sushko GB, Shishaeva AS. Modeling of Separated Flows in CFD Software FlowVision-HPC. Numerical Methods and Programming. 2010;11(1):234–245. URL: https://num-meth.ru/index.php/journal/article/view/395/402 (accessed: 18.09.2023). (In Russ.)
7. Konovalov DA, Shmatov DP, Drozdov IG, Dahin SV. Simulation of Heat and Mass Transfer in Porous Elements of Thermal Protection Systems Using Software FlowVision. Bulletin of Voronezh State Technical University. 2011;7(4):143–147.
8. Mazitov AA, Bobreneva YuO, Gubaydullin IM, Poveshchenko YuA. Mathematical Modeling of a Multiphase Flow in a Single-Pore Reservoir. Preprints of the Keldysh Institute of Applied Mathematics. 2022;62:1–14. https://doi.org/10.20948/prepr-2022-62
9. Fedorov AA, Bykov AN. The Method of Two-Level Parallelization for Solving Tridiagonal Systems on Hybrid Computers with Multicore Coprocessors. In: Proc. Int. Sci. Conf. Parallel Computational Technologies. Chelyabinsk: SUSU Publishing Center; 2016. P. 334–346.
10. Bykov AN, Erofeev AM, Sizov EA, Fedorov AA. A Parallel Sweep Method for Hybrid Supercomputers. Numerical Methods and Programming. 2013;14(2):43–47.
11. Bobreneva YuO, Rahimly PI, Poveshchenko YuA, Podryga VO, Enikeeva LV. On One Method of Numerical Modeling of Piezoconductive Processes of a Two-Phase Fluid System in a Fractured-Porous Reservoir. Journal of Physics: Conference Series. 2021;2131:022001. https://doi.org/10.1088/1742-6596/2131/2/022001
12. Bobreneva YuO, Mazitov AA, Gubaydullin IM. Mathematical Modeling of Fluid Flow Processes in the Fractured-Porous Reservoir. In: Proc. V Int. Conf. and the Youth School “Information Technologies and Nanotechnologies”. Samara: Novaya tekhnika; 2018. P. 1775–1780. (In Russ.)
13. Gubaydullin IM, Koledina KF, Safin RR. Automated System for Structural and Parametric Identification of Kinetic Models of Chemical Reactions Involving Organometallic Compounds Based on the Kinetic Research Database. Control Systems and Information Technologies. 2014;58(4):10–16. (In Russ.)
14. Gubaydullin IM, Koledina KF, Spivak SI. Structural and Parametric Identification of Kinetic Models of Chemical Reactions Involving Organometallic Compounds Based on an Information and Computational Analytical System. Chemical Industry Developments. 2014;11:18–27. (In Russ.)
15. Grinberg M. Flask Web Development, 2nd ed. Sebastopol, CA: O'Reilly Media, Inc.; 2018. 312 p.
16. Au-Yeung J. Vue.js 3 By Example: Blueprints to Learn Vue Web Development, Full-Stack Development, and Cross-Platform Development Quickly. Birmingham, UK: Packt Publishing; 2021. 320 p.
17. Riggs S, Ciolli G. PostgreSQL 14 Administration Cookbook. Birmingham, UK: Packt Publishing; 2022. 608 p.
18. DeBarros A. Practical SQL, 2nd Edition: A Beginner's Guide to Storytelling with Data. San Francisco, CA: No Starch Press; 2022. 464 p.
Aynur A. Mazitov, Intern researcher, Laboratory of Mathematical Chemistry
141, pr. Oktyabrya, Ufa, 450075
Mazitov A.A. Web Application for Mathematical Modeling of Unsteady Oil Flow in Porous Medium. Advanced Engineering Research (Rostov-on-Don). 2023;23(4):422-432. https://doi.org/10.23947/2687-1653-2023-23-4-422-432. EDN: RBUFLG


Advanced Engineering Research (Rostov-on-Don)
ISSN 2687-1653 (Online)
Contact with: Publisher / Editorial Office of the Journal
Publisher: Don State Technical University - DSTU, Rostov-on-Don, Russia - https://donstu.ru/en/
Editor-in-Chief: Alexey N. Beskopylny, Dr.Sci. (Eng.), Professor, Vice-Rector, Don State Technical University (Rostov-on-Don, Russia)
Don State Technical University
1, Gagarin Sq., Rostov-on-Don, 344003, Russia
tel.: +7 (863) 2738-372, e-mail: vestnik@donstu.ru
16+
Processing of personal data