Contents
Scroll to:
https://doi.org/10.23947/2687-1653-2024-24-3-283-292
EDN: SICESA
Scroll to:
Introduction. Computer vision is widely used for semantic segmentation of Earth remote sensing (ERS) data. The method allows monitoring ecosystems, including aquatic ones. Algorithms that maintain the quality of semantic segmentation of ERS images are in demand, specifically, to identify areas with phytoplankton, where water blooms— the cause of suffocation — are possible. The objective of the study is to create an algorithm that processes satellite data as input information for the formation and checking of mathematical models of hydrodynamics, which are used to monitor the state of water bodies. Various algorithms for semantic segmentation are described in the literature. New research focuses on enhancing the reliability of recognition — often using neural networks. This approach is modified in the presented work. To develop the direction, a new set of information from open sources and synthetic data are proposed. They are aimed at improving the generalization ability of the model. For the first time, the contour area of the phytoplankton population is compared to the database — and thus the boundary conditions are formed for the implementation of mathematical models and the construction of boundary-adaptive grids.
Materials and Methods. The set of remote sensing images was supplemented with the author's augmentation algorithm in Python. Computer vision segmented areas of phytoplankton populations in the images. The U-Net convolutional neural network (CNN) was trained on the basis of NVIDIA Tesla T4 computing accelerators.
Results. To automate the detection of phytoplankton distribution areas, a computer vision algorithm based on the U-Net CNN was developed. The model was evaluated by the calculated values of the main quality metrics related to segmentation tasks. The following metric values were obtained: Precision = 0.89, Recall = 0.88, F1 = 0.87, Dice = 0.87, and IoU = 0.79. Graphical visualization of the results of CNN learning on the training and validation sets showed good quality of model learning. This is evidenced by small changes in the loss function at the end of training. The segmentation performed by the model turned out to be close to manual marking, which indicated the high quality of the proposed solution. The area of the segmented region of the phytoplankton population was calculated by the area of one pixel. The result obtained for the original image was 51202.5 (based on information about the number of pixels related to the bloom of blue-green algae). The corresponding result of the modeling was 51312.
Discussion and Conclusion. The study expands theoretical and practical knowledge on the use of convolutional neural networks for semantic segmentation of space imagery data. Given the results of the work, it is possible to assess the potential for automating the process of semantic segmentation of remote sensing data to determine the boundaries of phytoplankton populations using artificial intelligence. The use of the proposed computer vision model to obtain contours of water bloom due to phytoplankton will provide for the creation of databases — the basis for environmental monitoring of water resources and predictive modeling of hydrobiological processes.
Belova Yu.V., Razveeva I.F., Rakhimbaeva E.O. Development of an Algorithm for Semantic Segmentation of Earth Remote Sensing Data to Determine Phytoplankton Populations. Advanced Engineering Research (Rostov-on-Don). 2024;24(3):283-292. https://doi.org/10.23947/2687-1653-2024-24-3-283-292. EDN: SICESA
Introduction. Automated algorithms for processing information received from satellites are needed in various fields of activity. Solving fundamental and applied problems of ecology requires segmentation of regions in accordance with the focus of attention of researchers. This optimizes the process of studying and modeling hydrobiological processes. An example of such local interest is the bloom of water due to the spread of phytoplankton. The phenomenon is important for current and complex monitoring of water resources. It is clearly visible from satellites during remote sensing of the Earth (ERS).
Water bloom affects significantly its quality in surface sources used for domestic water supply systems [1]. The reaction of phytoplankton populations in the hydrological environment can reliably assess the general state of the aquatic ecosystem [2]. The negative consequences of uncontrolled algae growth are mass death of fish (suffocation), increased load on water purification plants [3], and pollution of shores and beaches [4].
Systematic measurements at automatic water quality monitors, as well as obtaining data from research expeditions, are labor-intensive and expensive activities. An additional source of information on the state of the phytoplankton community is modern satellite systems equipped with survey instruments. They allow remote recording of the state of the algae biomass, tracking its dynamics in a given time period.
A significant advantage of satellite data as a tool for monitoring water resources is the possibility of full-scale and operational control at any point on Earth. A wide view of the water area, as a rule, gives researchers a significant amount of useful information. But, despite the active development of systems based on computer vision algorithms, the problem of identifying the contours of regions of interest in remote sensing data has not yet been fully solved.
Good results are obtained by various algorithms of semantic segmentation on images. With their help, it is possible to identify and clarify the boundaries and structure of natural objects. In [5], the efficiency of the LBP method (local binary patterns) for recognizing objects consisting of curvilinear contours is shown. LBP provides high edge sharpness and detail of Earth satellite sensing data. In [6], it is noted that to increase the reliability of recognition, it is required to combine artificial intelligence algorithms and such classical methods of image edge detection as Sobel, Kirsch and Laplace operators. In [7], a comprehensive approach is proposed for semantic processing of satellite images of unlimited size using U-Net neural network models, which showed an F1-score value from 0.78 to 0.91 when detecting objects.
Paper [8] provides an overview of intelligent methods for solving the problem of semantic segmentation of data on satellite images. The authors conclude that in this case, neural network algorithms are the most effective and productive. As an example, a convolutional neural network (CNN) is given, trained on several thousand satellite images of Massachusetts (USA). The accuracy of the model was 85.31%. In [9], semantic segmentation, instance segmentation, and panoptic segmentation are considered. The advantages of using deep learning methods implemented in the architectures of such CNN as SegNet, U-Net, and DeepLab are specified. In [10], automated processing of satellite images is based on a combination of the SpaceNet dataset and progress in computer vision which are made possible by deep learning. This paper presents five approaches based on improvements to the U-Net and Mask R-Convolutional Neural Networks models. The metric values for the best models are as follows: average precision (AP) and average recall (AR) are 0.937 and 0.959, respectively. An effective application of CNN for detecting contrails on satellite images is described in [11]. It is proven that in large-scale monitoring of contrails with measurement of their impact on climate, the approach based on CNN of U-Net architecture demonstrates F1-score equal to 0.52, with an overall average detection probability of 0.51.
The 2023 models Segment Anything (SAM), Language-Segment-Anything (Lang-SAM), and HQ-SAM are of particular interest. These are dynamic deep learning tools that can predict object masks from images using input hints. Several researchers have already applied this approach to the analysis of aerial photographs and ERS data. The accuracy of identifying areas of interest has proven to be high [12]. In [13], the F1- score value reaches 86.5%±4.1%. In the future, models of similar architecture with various modifications (Polyp-SAM, Grounding DINO, etc.) will provide for both interactive (requiring user intervention) and automatic segmentation.
Intelligent technologies are increasingly being introduced to process remote sensing data. High accuracy of models is noted. Particular attention is paid to methods based on such CNN as SegNet, U-Net, DeepLab in combination with classical methods of image preprocessing. A generalized approach to segmentation is actively developing.
This paper considers the solution to a problem in the ERS data assimilation using computer vision. The application of U-Net CNN for segmentation of areas containing phytoplankton populations is shown. The algorithm created by the authors provides for the segmentation of regions of interest and calculation of their areas, which is required for further analysis when solving problems of hydrodynamics and hydrobiology.
The following four points describe the scientific novelty of the presented study.
To achieve the set goal, it is required to solve a number of problems:
The theoretical significance of the study is due to the expansion of ideas about the possibilities of using computer vision technology in the field of water resources monitoring. The practical significance consists in the development of an applied cross-platform and scalable tool for analyzing remote sensing images to record regions of interest in aquatic ecosystems.
Materials and Methods. For geospatial analysis, we use open-source software that is often applied to solve environmental problems [15].
The study is based on current satellite data. The authors focus on the state of water bodies during the bloom of blue-green algae. Analysis of this information allows:
To automate the process of detecting regions of phytoplankton populations and calculating their areas, it is proposed to develop a computer vision algorithm based on the U-Net CNN architecture.
As a training sample for the deep learning algorithm, 20 space images of water bodies such as the Black, Caspian, Azov Seas, etc., were taken. The photos were obtained at different points on the earth's surface.
The first step was to label the images to transform the information into a format that could be understood by the computer vision algorithm for performing the segmentation. There were two common approaches to providing annotations:
We have used the first option, where the pixel-level mask files represent regions of interest for the algorithm. The marked masks are files with the extension jpeg or png. The proportions correspond to the image they annotate. Figure 1 shows an example of the original image and its mask, where green indicates land, blue indicates water surface, and red indicates the region of the phytoplankton population.
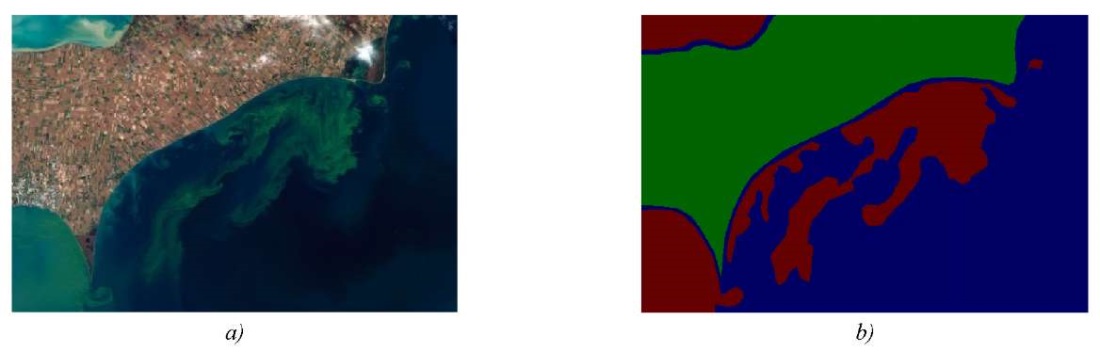
Fig. 1. Image mapping: a — original image; b — image mask
To increase the number of images in the data set, we used the authors' augmentation code, supplemented with noise effects. When creating the extended data set, we used the following modifications of the original images:
All changes were made taking into account the noise that may appear on real images obtained through remote sensing, and were segmented using the developed algorithm.
Let us note the advantage of the authors' algorithm for creating additional source data. Under conditions of a limited set of real images, the use of artificially created images for training will allow for a more fine-tuning of the developed model, optimizing its parameters and making it more resistant to distortion in practical application.
The U-Net CNN architecture is designed to solve the problem of biomedical data segmentation. The determining factor in its selection is the relatively small size of the initial data, with which U-Net shows satisfactory results in practice.
The U-Net CNN architecture is based on the interaction of convolution layers + pooling, which first reduce the spatial resolution of the image (encoder), and then increase it, having previously combined it with the image data and passed it through other convolution layers (decoder) (Fig. 2).
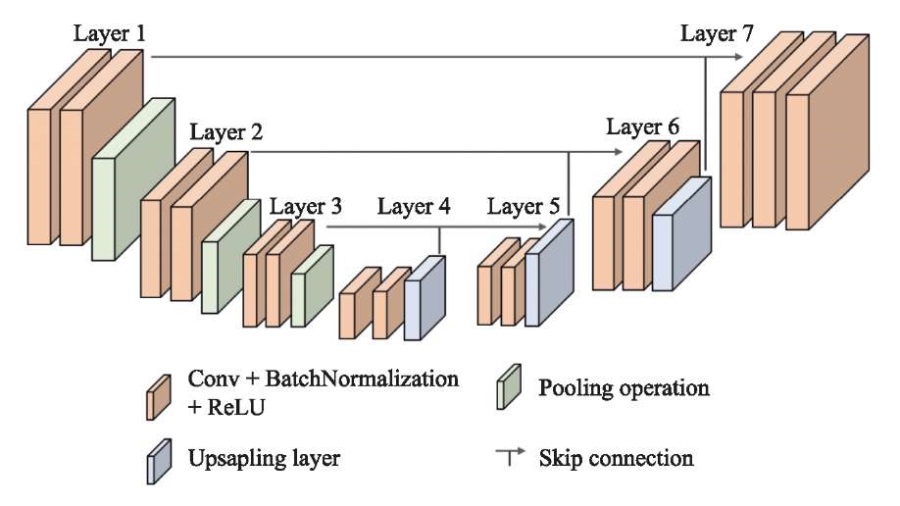
Fig. 2. Architecture of U-Net SNN
The convolutional blocks of the decoder and encoder are linked by end-to-end connections, or skip connections. This solves the problem of vanishing gradient, which is a challenge for computer vision [20]. In this study, we used the encoder from the ResNet–50 neural network, pre-trained on the ImageNet dataset.
To select the hyperparameters of the U-Net CNN that affect the architecture and training process, the Optuna library was used. This made it possible to automate the model tuning to achieve better results.
Research Results. Table 1 shows the model parameters specified under training.
Table 1
Parameters for Training the U-Net Convolutional Neural Network
|
No. |
Parameter |
Value |
|
1 |
Number of images in training set |
700 |
|
2 |
Number of images in validation set |
200 |
|
3 |
Number of images in test sample |
100 |
|
4 |
Batch size |
10 |
|
5 |
Learning rate |
1st-4 |
|
6 |
Overfitting detector |
Early stopping |
|
7 |
Solver |
Adam |
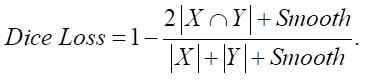
The model was trained using optimization of the Dice loss function (2) based on the Dice coefficient (1).
 (1)
(1)
 (2)
(2)
Here, X — a set of pixels defined during the mapping as a scope of a specific class; Y — a set of pixels assigned to a specific class according to the conclusions of the developed segmentation model. The Smooth coefficient is used to smooth the calculation result in the case when the values X and Y are close to zero.
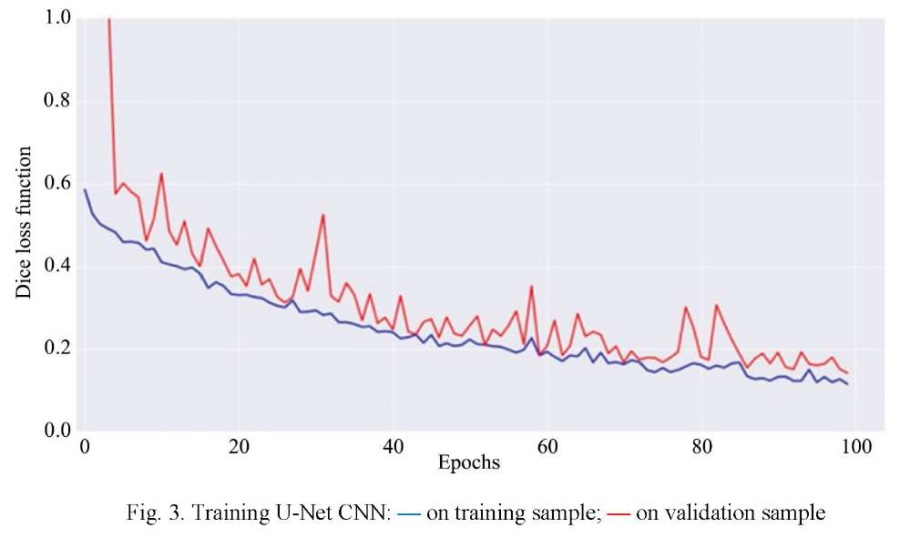
The Adam method for stochastic optimization was used to train the model. Early stopping was used as an overfitting detector. In machine learning, this is one of the most widely used regularization methods to prevent overfitting. The training process was performed on the basis of NVIDIA Tesla T4 computing accelerators, it was implemented in 100 epochs and took 55 minutes.
Figure 3 shows the graph of CNN training on the training and validation sets. The OX axis shows the training epochs, and the OY axis shows the values of the loss function. Analyzing the graph, we can conclude that the quality of model training is good, since at the end of training on the training sample, small changes in the loss function are observed.
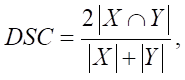
When assessing the quality of segmentation models, the Dice coefficient and the metric of the degree of intersection between two bounding rectangles (Intersection over Union — IoU, Jaccard index), determined form the following formula, are used:
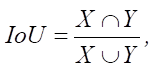 (2)
(2)
where X — a set of pixels defined under the mapping as a scope of a concrete class; Y — a set of pixels assigned to a concrete class according to the conclusions of the developed segmentation model.
Table 2 presents the values of per-pixel precision, recall, F1-score, Dice coefficient, and IoU. To obtain the final IoU value, the weighted average is calculated for the values of this metric for each class.
Table 2
Results of Model Quality Assessment on the Test Sample
|
Metric |
Precision |
Recall |
F1 |
Dice |
IoU |
|
Average value for test sample |
0.89 |
0.88 |
0.87 |
0.87 |
0.79 |
Figure 4 shows the results of the algorithm's work on segmenting regions of water resources, land and phytoplankton populations. The results obtained satisfy the tasks of water resource monitoring and have practical value.
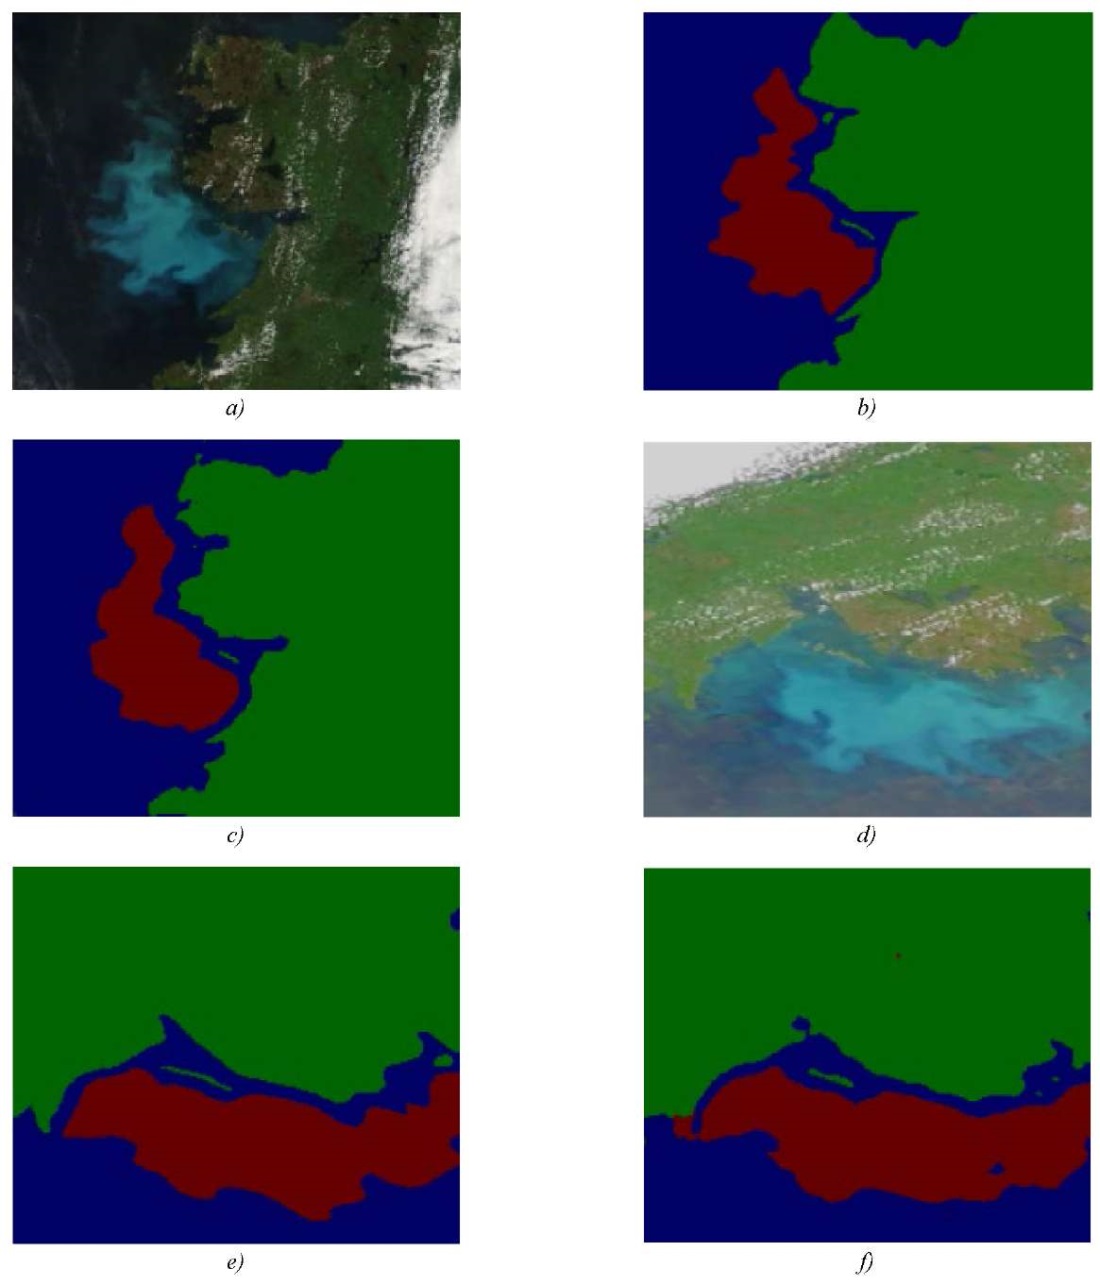
Fig. 4. Algorithm results for segmenting areas
of water resources, land and phytoplankton populations:
a, d — original image; b, e — manual mapping; c, f — model result
The segmentation result in Figures 4 c and 4 f is visually close to manual mapping, which indicates the high quality of the model. The area of the segmented region of the phytoplankton population was calculated by estimating the area of one pixel. Each image provided has additional metadata indicating the image scale and its resolution. Based on this value, the area occupied by each pixel is calculated. In the case considered for Figure 4 a, the final value is 51202.5. This figure was obtained according to information on the number of pixels related to blue-green algae blooms from a set of segmented images of phytoplankton populations in coastal systems [21]. The calculation result for Figure 4 c is 51312.
Discussion and Conclusion. When assessing the state of water resources, computer vision and other machine learning algorithms allow specialists to become free from monotonous operations. They are performed by intelligent systems. In this case, monitoring can be carried out round-the-clock. The algorithm will adequately predict risks, model the development of situation, and support the adoption of operational decisions. Stored and replicated knowledge in the form of databases and registers can be used to create long-term sources of information that researchers can use to analyze the state of water bodies and build climate models.
Processing ERS data in the form of semantic contours will provide verifying complex mathematical models through refining boundary and initial conditions, increasing the accuracy, speed and reliability of predictive modeling of hydrobiological processes.
1. Yun Zhang, Wanli Gao, Yuying Li, Yeqing Jiang, Xiaonuo Chen, Yinlei Yao, et al. Characteristics of the Phytoplankton Community Structure and Water Quality Evaluation in Autumn in the Huaihe River (China). International Journal of Environmental Research and Public Health. 2021;18(22):12092. https://doi.org/10.3390/ijerph182212092
2. Huang Yiqiang, Shen Yucheng, Zhang Shouzhi, Li Yang, Sun Zeyu, Feng Mingming, et al. Characteristics of Phytoplankton Community Structure and Indication to Water Quality in the Lake in Agricultural Areas. Frontiers in Environmental Science. 2022;10:1–14. http://doi.org/10.3389/fenvs.2022.833409
3. Govorova ZhM, Govorov OB. Influence of Phytoplankton on the Formation of Water Quality and Methods of its Removal. Part 1. Plumbing, Heating, Air Conditioning. 2019;206(2):32–35. (In Russ.) URL: https://www.c-o-k.ru/articles/vliyaniefitoplanktona-na-formirovanie-kachestva-vody-i-metody-ego-udaleniya-chast-1 (accessed: 04.06.2024).
4. Erina ON, Puklakov VV, Sokolov DI, Goncharov AV. Subglacial Phytoplankton Bloom in the Mozhaisk Reservoir. Yu.A. Ovchinnikov Bulletin of Biotechnology and Physical and Chemical Biology. 2019;15(2):49–54. (In Russ.) URL: https://biorosinfo.ru/upload/file/journal_56.pdf (accessed: 04.06.2024).
5. Panasenko ND, Poluyan AYu, Motuz NS. Algorithm for Monitoring the Plankton Population Dynamics Based on Satellite Sensing Data. Journal of Physics: Conference Series. 2021;2131(3):032052. https://doi.org/10.1088/17426596/2131/3/032052
6. Panasenko ND, Ganzhur MA, Ganzhur AP. Multichannel Satellite Image Application for Water Surface Objects Identification. Engineering Journal of Don. 2020;72(12):376–387. URL: http://www.ivdon.ru/uploads/article/pdf/IVD_1911_Panasenko_ Ganzhur1.pdf_244b44d819.pdf (accessed: 04.06.2024).
7. Yanakova ES, Tyurin AA. Complex Algorithm for Semantic Processing of Satellite Images. Izvestiya TulGU. 2020;(10):183–189.
8. Druki AA, Spitsyn VG, Bolotova YuA, Bashlykov AA. Semantic Segmentation of Earth Remote Sensing Data Using Neural Network Algorithms. Bulletin of Tomsk Polytechnic University. Geo Assets Engineering. 2018;329(1):59–68. URL: https://earchive.tpu.ru/bitstream/11683/46113/1/bulletin_tpu-2018-v329-i1-07.pdf (accessed: 04.06.2024).
9. Lukashik DV. Analysis of Modern Image Segmentation Methods. Economics and Quality of Communication Systems. 2022;24(2):57–65. URL: https://journal-ekss.ru/wp-content/uploads/2022/06/57-65.pdf (accessed: 04.06.2024).
10. Mohanty S, Czakon J, Kaczmarek K, Pyskir A, Tarasiewicz P, Kunwar S, et al. Deep Learning for Understanding Satellite Imagery: An Experimental Survey. Frontiers in Artificial Intelligence. 2020;3:534696. http://doi.org/10.3389/frai.2020.534696
11. Hoffman JP, Rahmes TF, Wimmers AJ, Feltz WF. The Application of a Convolutional Neural Network for the Detection of Contrails in Satellite Imagery. Remote Sensing. 2023;15(11):2854. https://doi.org/10.3390/rs15112854
12. Ren Yougui, Xiaomei Yang, Zhihua Wang, Ge Yu, Yueming Liu, Xiaoliang Liu, et al. Segment Anything Model (SAM) Assisted Remote Sensing Supervision for Mariculture — Using Liaoning Province, China as an Example. Remote Sensing. 2023;15(24):5781. https://doi.org/10.3390/rs15245781
13. Alagialoglou L, Manakos I, Papadopoulou S, Chadoulis R-T, Kita A. Mapping Underwater Aquatic Vegetation Using Foundation Models With Airand Space-Borne Images: The Case of Polyphytos Lake. Remote Sensing. 2023;15(16):4001. https://doi.org/10.3390/rs15164001
14. Beskopylny AN, Stelmakh SA, Shcherban EM, Razveeva IF, Kozhakin AN, Beskopylny NA, et al. Image Augmentation Software. RF Patent, No. 2022685192. 2022. (In Russ.) URL: https://new.fips.ru/registers-docview/fips_servlet?DB=EVM&DocNumber=2022685192&TypeFile=html (accessed: 04.06.2024).
15. Cortés IM. Open-Source Software for Geospatial Analysis. Nature Reviews Earth and Environment. 2023;4(143):1. https://doi.org/10.1038/s43017-023-00401-4
16. Razveeva IF, Rakhimbaeva EO. Application of Artificial Intelligence Methods in the Analysis of Phytoplankton Populations on the Water Surface. In: Proc. International Scientific Conference “Intelligent Information Technologies and Mathematical Modeling”. Rostov-on-Don: DSTU Publ. House; 2022. P. 45–49.
17. Hopkins JE, Palmer MR, Poulton AJ, Hickman AE, Sharples J. Control of a Phytoplankton Bloom by WindDriven Vertical Mixing and Light Availability. Limnology and Oceanography. 2021;66:1926–1949. https://doi.org/10.1002/lno.11734
18. Yanhui Dai, Shangbo Yang, Dan Zhao, Chuanmin Hu, Wang Xu, Donald M Anderson, et al. Coastal Phytoplankton Blooms Expand and Intensify in the 21st Century. Nature. 2023;615:280–284. https://www.nature.com/articles/s41586-023-05760-y
19. Asselot R, Lunkeit F, Holden P, Hense I. Climate Pathways behind Phytoplankton-Induced Atmospheric Warming. Biogeosciences. 2022;19(1):223–239. http://doi.org/10.5194/bg-19-223-2022
20. Kaiming He, Xiangyu Zhang, Shaoqing Ren, Jian Sun. Deep Residual Learning for Image Recognition. In: Proc. IEEE Conference on Computer Vision and Pattern Recognition (CVPR). New York City: IEEE; 2016. P. 770–778. https://doi.org/10.48550/arXiv.1512.03385
21. Belova YuV, Razveeva IF, Rakhimbaeva EO. A Program for Delineating the Area of Phytoplankton Populations in Coastal Systems. RF Patent, No. 2022684631. 2022. (In Russ.) URL: https://new.fips.ru/registers-docview/fips_servlet?DB=EVM&DocNumber=2022685220&TypeFile=html (accessed: 04.06.2024).
Yulia V. Belova, Cand.Sci. (Eng.), Associate Professor of the Mathematics and Computer Science Department
1, Gagarin Square, Rostov-on-Don, 344003
Irina F. Razveeva, Senior Lecturer of the Construction of Unique Buildings and Structures Department
1, Gagarin Square, Rostov-on-Don, 344003
Elena O. Rakhimbaeva, Postgraduate student, Teaching assistant of the Computer and Automated Systems Software Department
1, Gagarin Square, Rostov-on-Don, 344003
Belova Yu.V., Razveeva I.F., Rakhimbaeva E.O. Development of an Algorithm for Semantic Segmentation of Earth Remote Sensing Data to Determine Phytoplankton Populations. Advanced Engineering Research (Rostov-on-Don). 2024;24(3):283-292. https://doi.org/10.23947/2687-1653-2024-24-3-283-292. EDN: SICESA

Advanced Engineering Research (Rostov-on-Don)
ISSN 2687-1653 (Online)
Contact with: Publisher / Editorial Office of the Journal
Publisher: Don State Technical University - DSTU, Rostov-on-Don, Russia - https://donstu.ru/en/
Editor-in-Chief: Alexey N. Beskopylny, Dr.Sci. (Eng.), Professor, Vice-Rector, Don State Technical University (Rostov-on-Don, Russia)
Don State Technical University
1, Gagarin Sq., Rostov-on-Don, 344003, Russia
tel.: +7 (863) 2738-372, e-mail: vestnik@donstu.ru
16+
Processing of personal data