ANNIVERSARY OF THE SCIENTIST

MECHANICS
Introduction. One of the reasons for undesirable delamination of polymer composites with fabric reinforcement is low transverse shear properties. It is known that the reinforcement of polymer fabric composites in the Z direction reduces the sensitivity to delamination and increases the viscosity of interlayer fracture. Various methods of three-dimensional reinforcement of polymer fabric composites are proposed in the literature. However, they complicate the manufacturing process of the structure. The problem is solved by the method of three-dimensional reinforcement proposed in this article — felting. This is a local reinforcement of the composite in the Z direction with minimal production changes. The degree of Z-reinforcement is determined by the felting density, i.e., the number of needle punches per 1 cm² of the fabric package. The work is aimed at evaluating the effect of felting on the interlayer crack resistance of a composite material.
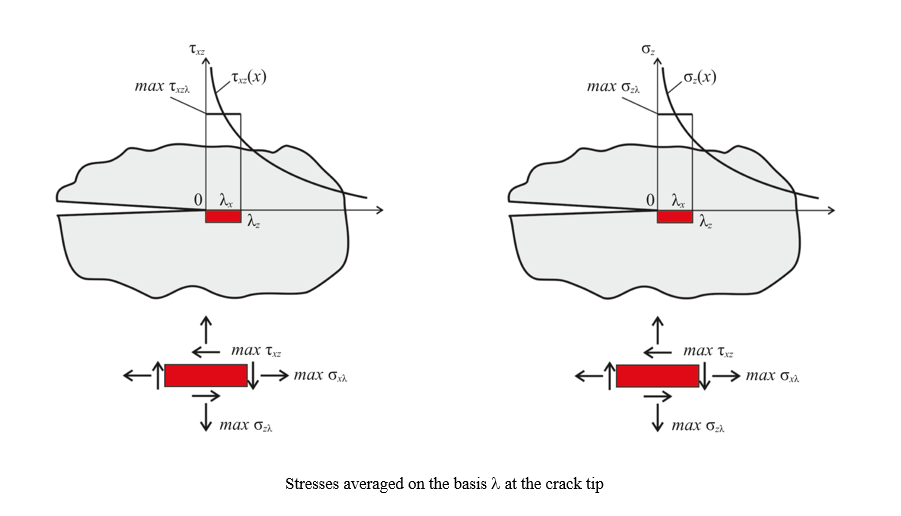
Materials and Methods. The interlayer fracture toughness GIIc was determined on a cross-woven fiberglass with felting of 10 cm-². The material was impregnated with Etal-370 resin and Etal-45 hardener. Experiments according to ASTM D7905M–14 and GOST 33685–2015 standards were carried out on an Instron 5900R test machine. The stress state at the crack tip was analyzed with regard to the nonlocal strength theory in the ANSYS Workbench program (option “static strength analysis”). The finite element method (FEM) was used.
Results. The “load — displacement” curves were considered for the samples. Values GIIc were calculated. The results of ENF tests for felting density of 0 cm–² and 10 cm–² were summarized. Control samples and felting samples were compared. In the latter case, GIIс turned out to be ~33% higher. The stress state at the crack tip was calculated under DCB and ENF loading. The dependences of maximum normal and shear stresses, as well as displacements, were visualized in the form of graphs and color charts. To get the calculated “load — displacement” dependences using FEM, the reverse method of obtaining transverse shear constants was used. DCB loading showed that felting provided increasing the rupture strength in the Z direction to ~18%, by 39 to 46 MPa, and in the planes XZ— to ~16%, by 77 to 89 MPa.
Discussion and Conclusion. Felting as a method of local three-dimensional reinforcement enhances the interlayer crack resistance of polymer fabric composites. It provides reducing the area of stratifications after local impacts during the operation of structures. Flexible felting technology makes it possible to create zones with an arbitrary impact density, increasing fracture toughness only in the required places of structures. The FEM analysis of the stress state at the crack tip within the framework of the nonlocal strength theory has shown that in strength calculations, the stratification crack can be considered as a stress concentrator.
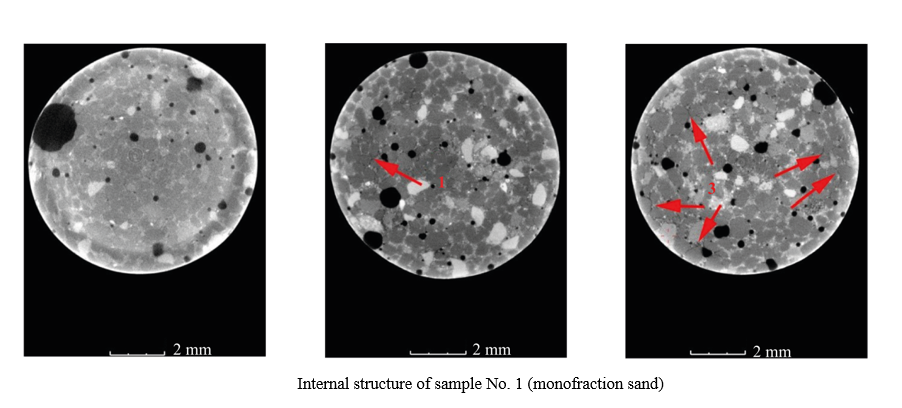
Introduction. When studying composite materials for construction purposes, it is needed to consider the mechanisms of formation of the structure and properties of modern concretes in the process of strength development. In studies of modern composite materials based on cement binder, there is no information about the development of structural defects and destruction of the material at the initial stages of strength development. This information can be obtained using X-ray computed tomography, a promising method of nondestructive testing of the state of the material. Therefore, the objective of this work was to study the formation and propagation of cracks in samples of fine-grained concrete with different fractional composition of sand due to natural processes of cement shrinkage, as well as the mechanics of destruction of samples of modified fine-grained concrete when applying a compressive load at the early stages of strength development. Materials and Methods. The study used fine-grained concrete mixtures of three compositions with different sand gradation. The tomography samples were made by placing fresh mixtures in polymer cylindrical containers. Tomography of the samples immediately after manufacture, as well as after 8 and 51 days, was performed in a YXLON Cheetah microfocus X-ray machine. The composition with two-fraction sand was modified by mechanical activation of the components, 20×20×20 mm cube samples were made. Further, compression tests were performed at the Instron installation after 3 and 7.5 hours, and then — tomography of the destroyed samples.
Results. It was established that the destruction of contact zones depended on the ratio of the size of the fractions. In the presence of a bulk of coarse sand grains in concrete, the destruction of contact zones was more pronounced and had a main mode. When using fine or polyfraction sand, contact zones were destroyed locally and had a visually smaller area. The images of the destroyed modified sample, tested 3 hours after manufacturing, showed clear cracks and indents on the edges, which indicated the elastic-plastic nature of the destruction. In 7.5 hours, the edges of the sample upon destruction were covered with a network of small cracks; inside the sample there were also numerous cracks and microcracks, which indicated brittle fracture. Based on the obtained images of the deformed structure of modified concrete, the mechanism of transition from elastic-plastic destruction of the material to brittle one was clearly visible.
Discussion and Conclusion. The studied dependences of the influence of the size of fine aggregate on the mechanisms of formation and propagation of structural defects contribute to the theory of the processes of destruction of fine-grained concretes. The results obtained prove the prospects of using X-ray computed tomography as a method of nondestructive testing of the internal structure of fine-grained concrete, including at the early stages of strength development.
MACHINE BUILDING AND MACHINE SCIENCE
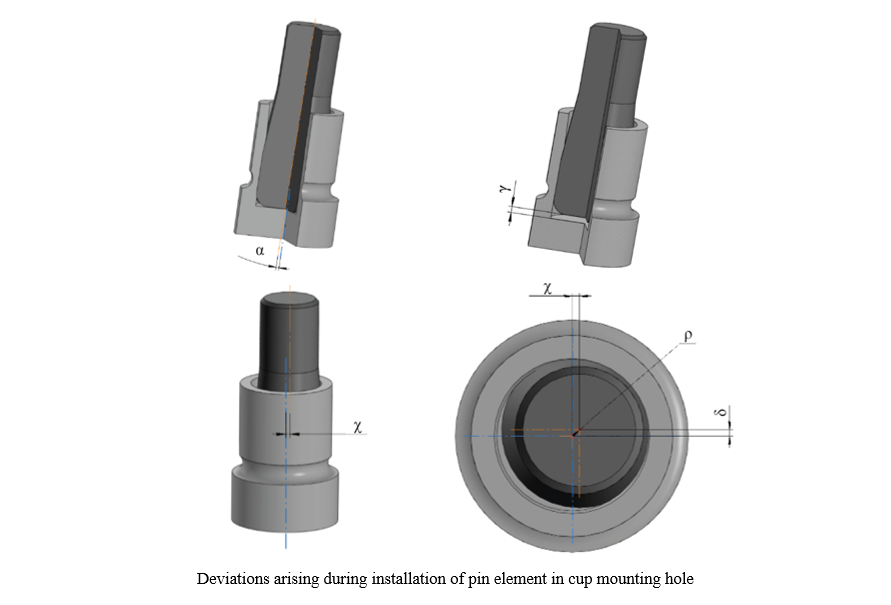
Introduction Violation of mutual positioning and fixation of parts worsens the operation of the equipment. Traditional approaches to solving the problem under consideration have been sufficiently studied: interchangeability of parts and the use of special equipment. Both methods involve a significant number of additional elements and assembly operations. Fixation is often provided by means of force fitting and welding. Disadvantages of these methods include assembly, residual and other stresses, engineering constraints, etc. To solve these problems, alloys with thermoelastic phase transformations are used, which provide shape memory effects (SME) to manifest themselves. This article describes, for the first time, self-positioning and self-fixation using the example of parts specially made from an alloy with SME. Materials and Methods. The pin element under pressing mandrels the blind hole of the cup and enters the seat. The alloy with SME was Ti-55.7wt%Ni. The temperature of the onset of its austenitic transformation was As = 95°C ± 5°C. The elemental composition was determined by a Shimadzu EDX-8000 X-ray fluorescence spectrometer, the phase composition — by a Shimadzu XRD-7000 diffractometer. The temperature was specified through differential scanning calorimetry. The range was 20–300°C, the heating rate was 5 deg/min. A Guide T120 thermal imager and a RangeVision DIY 3D scanner with structured illumination were used. After pressing the pin into the cup at different angles, the alignment and deviations between the axes of the cup and the pin were examined. Then, the cup was heated to 110–120°C, cooled, and control measurements were taken.
Results. Values of the deflection angle after pressing were 0.2–11°. With a rigid structure and an installation angle of 0°, the pin deflected in the mounting hole by 0.2–0.5°. The axes shifted and did not intersect. The pin was not always completely pressed in. This indicated uneven deformation of the metal and different stress values around the hole. Such a unit would soon fail. The pin took the required position after heating the cup to 110–120°C (this temperature was higher than at the end of the reverse martensitic transformation). The angular deviation of the axes was noted to be 0.03–0.1°. The maximum misalignment (0.04 mm) corresponded to high positioning accuracy. Heating during the reverse martensitic transformation created internal stresses that returned the initial geometry of the cup. They also formed the forces that positioned and fixed the pin in the hole. That is, it is the parts that provide positioning and fixation (this is selfpositioning and self-fixation).
Discussion and Conclusion. For self-positioning and self-fixation of parts due to the shape memory effect, it is necessary to avoid sharp transition lines between the surfaces of parts during design, select rounded corners or fillets, and get a clean surface without burrs. Self-fixation and self-positioning reduce defects and inaccuracies during assembly. The use of certain alloys increases the profitability of equipment production.
Introduction. When drilling oil or gas wells, rock from the bottomhole is brought to the surface by drilling mud, which is cleaned of sludge by shale shakers at the first stage. Shale shakers are equipped with such a screen and create such trajectories of vibration of the frame in order to solve a dual problem: on the one hand, to provide the cleaning of the drilling mud coming from the well mouth, and on the other hand — to maintain the proper degree of cleaning. To correctly select the nomenclature of screens, it is necessary to reliably determine the throughput capacity of a shale shaker in the real-time setting. This will allow you to pre-order the required number of screens with the required cell size. Previously, studies were conducted by sieving a mixture of calibrated granules on a standard shaker or by straining mineral oil through a fixed screen. However, this does not fully correspond to the actual conditions of drilling mud screening. The objective of this article was to simulate the throughput of a drilling shale shaker under real conditions by calculating the movement of drilling mud along a vibrating screen using its previously obtained specific throughput capacity.
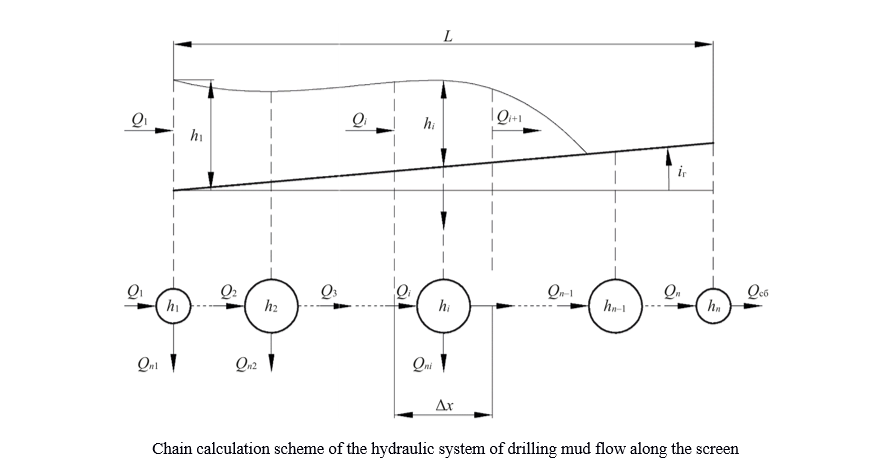
Materials and Methods. When creating a mathematical model of the full throughput capacity of a shale shaker, a previously known mathematical model of fluid flow in an open channel and a finite-dimensional approximation in the form of a sequence of sections of concentrated containers connected by hydraulic conductivities (by analogy with the approximation of long electrical lines and extended gas pipelines by the finite element method) were used. The fluid flow rate over the screen was determined according to Chézy law. In this case, the cross-sectional area of the flow above the screen for a specific section was specified as the arithmetic mean between the initial and final values of the drilling mud height in the corresponding section.
Results. A chain calculation scheme for sieving drilling mud was compiled. Based on the material balance, mathematical models were developed for determining the throughput and height of drilling mud above the screen: for the first section of the screen and the first nodal point of the screen; for subsequent screen sections and subsequent screen nodal points; for the last section of the screen and the last nodal point of the screen.
A mathematical model of the drilling mud movement along the shale shaker screen has been obtained, which, due to the finite-dimensional representation of this flow along n sections of the screen length, is a system of n integral equations describing concentrated tanks, and n – 1 algebraic equations describing the flow of drilling mud between tanks.
Discussion and Conclusion. The movement of drilling mud along the length of the shale shaker screen corresponds to the movement of a steady uneven flow in an open channel. However, in the first case, the volume flow along the length is variable (decreasing to zero), and in the second case, it is constant along the length. Therefore, the use of only one differential equation for steady uneven flow in an open channel is not sufficient in this case. The resulting mathematical model of the drilling mud movement along the shale shaker screen is a mathematical basis for the development of a modeling program to determine the throughput of the shale shaker for real operating conditions, i.e., for a specific drilling mud, a given screen or a given drive system of the shale shaker.
INFORMATION TECHNOLOGY, COMPUTER SCIENCE AND MANAGEMENT
Introduction. The scientific literature examines various approaches to quality management in information technology (IT). The issues of identifying and correcting defects are worked out, and the possibilities for minimizing them are shown. There are materials on quality management in complex engineering processes. At the same time, there is no detailed description of quality management at each stage of the IT product life cycle, including testing. It should be noted that the coordination of software releases is closely related to quality management, but this process is rarely or fragmentarily considered in the literature. Additionally, the interprocess communication is not taken into account; therefore, there is no comprehensive understanding of quality management in the creation, testing and refinement of software. This study is designed to fill these gaps. The research is aimed at presenting a comprehensive approach that links the theory, practice and methods of software quality management.
Materials and Methods. Theoretical and applied literature on the subject were studied, analyzed, and reviewed. The author's professional background in managing the quality of IT products was used. The practices of global suppliers of digital goods and services were taken into account. The author has used these materials and methods to study in detail the issues of software testing and code deployment.
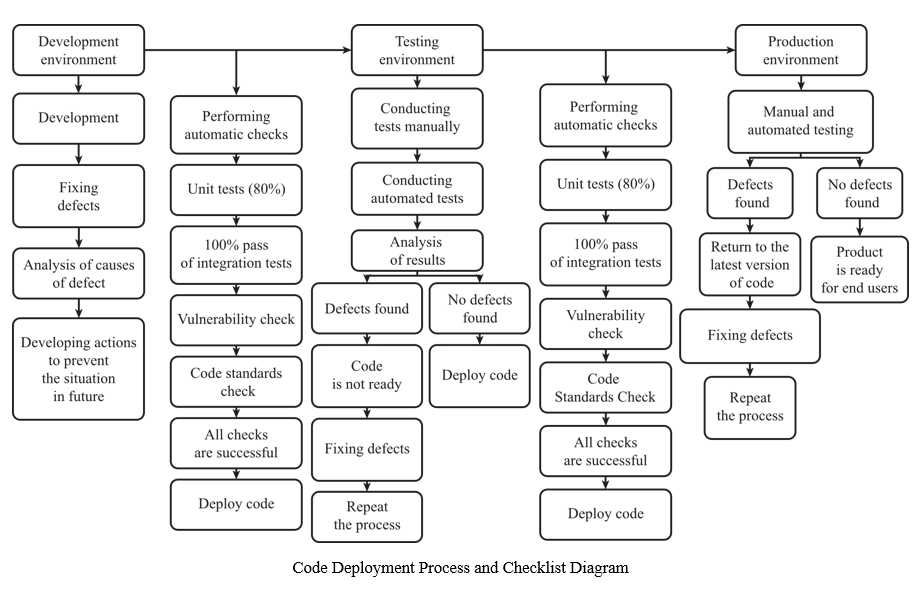
Results. A comprehensive model of quality management in software development is elaborated, described and presented in the form of a diagram. Its interconnections with the project management model and the product life cycle, namely: analysis, design, development, testing, deployment, and support, are identified. Principles of quality management at each of these stages are specified. The processes and checks during code deployment are systematized and presented in the form of a diagram. Their features are shown in three environments: during development, testing, and production.
Discussion and Conclusion. The algorithm allows quality experts to build the sequence of actions to eliminate detected defects in the future, understand the situation when it is possible (or impossible) to deploy code, and determine the moment when the software should be transferred to the user. In addition, the proposed scheme can be the basis for automating code deployment. The solution will reduce development time. As a result, the product will enter the market faster, which will speed up the payback of costs. The implementation of the model created within the framework of this scientific work into the production practice of IT companies presupposes strategic changes. Their implementation requires significant time and other resources; therefore, the overall transformation process should be divided into parts. The proposed approach is adaptable to the needs of various organizations and products. You can work with individual components to create an optimal plan for achieving quality management goals.
Introduction. Numerous researchers of the reliability of building structures pay attention to hardness, an important characteristic of the structural material. It is determined by indentation — pressing the tip of the tool into the surface. The advantages of dynamic indentation methods and the distribution of stress intensity on the surface and inside the sample are investigated. However, the condition of layered materials on impact has been poorly studied. The objective of the presented work is to consider indentation for a two-layer sample and determine the sensitivity of the top layer to the strength of the substrate. This will allow us to identify significant characteristics of the strength properties of homogeneous and heterogeneous structures.
Materials and Methods. An elastoplastic model of material behavior and a shock indentation scheme were used, which took into account the masses of the indenter and the striker coupled by linear springs. The surface of the indenter was conical, the opening angle was 120°. The impact was simulated in the MATLAB system. Finite element model in Ansys APDL was used to verify the data and analyze the results of the experiment. Traditional models of elasticity theory were used for calculations. The behavior of the material in the zone of plastic deformation was described using the options of multilinear isotropic hardening and the von Mises plasticity criterion.
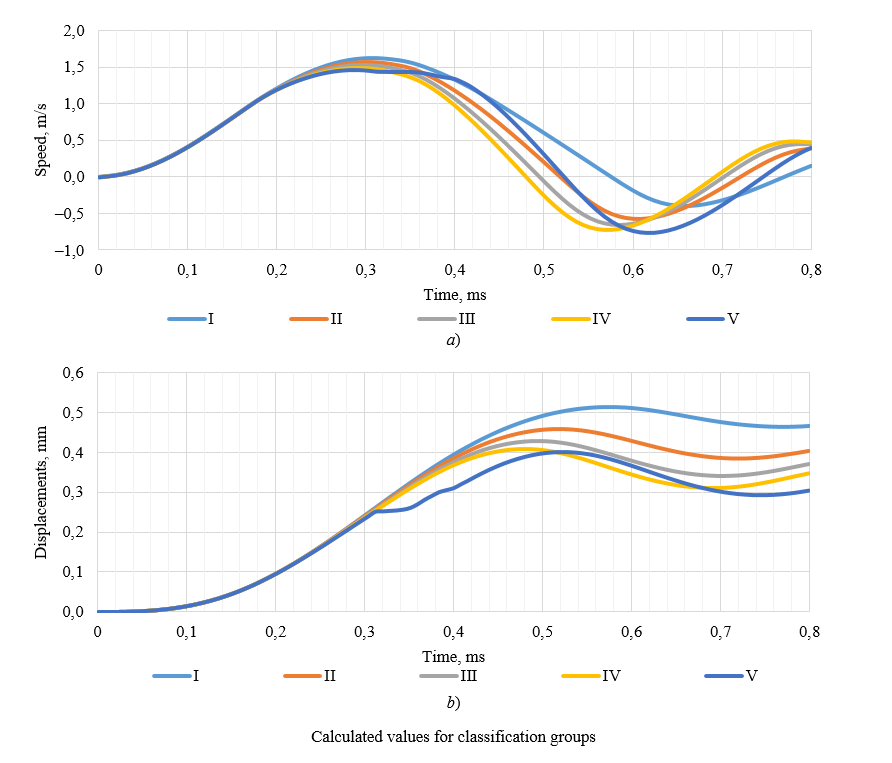
Results. The results of comparing three versions of varying the level of yield strength in the bottom layer are presented: when the yield strength in the bottom layer is half as high as the top one, equal to it, and twice as high. Displacements at different observation points for samples with a top layer of 2 mm and 1 mm were analyzed. In the first case, under horizontal shear, the displacement indices inside the sample did not change if the yield strength level was twice lower or higher than in the top one. If these indicators were equal, the difference became noticeable. In the second case (layer 1 mm), the difference in displacement was visible at all observation points. Thus, it can be reasonably concluded that a structure with a smaller top layer is more sensitive to impact. In the course of the research, it became known that vibrations associated with the transition to the plasticity zone occurred in the 2 mm zone, and elastic damping vibrations occurred below this zone. We solved the classification problem for the top layer of the material with changing characteristics of the base. The indicator for comparison was the Brinell hardness (HB) in the range of 200–600. The results were processed using a neural network and visualized in the form of graphs. The accuracy of its calculations was 98%.
Discussion and Conclusion. To determine the strength properties of homogeneous structures, it is sufficient to characterize the speed of displacement inside the sample. For an inhomogeneous structure, additional parameters should be introduced — displacements on the surface and inside the sample at fixed observation points. An integrated approach to determining the strength properties of an inhomogeneous structure improves the accuracy of calculations, and the use of neural networks increases their speed.
Introduction. Digital solutions make the operation of the company clearer, reduce staff costs, and provide data security. Various aspects of automation, digitalization and cloud technologies are described in the literature. The question is raised about the quality of the methodological basis for such transformations. Global and narrow technical approaches are presented. As a rule, materials are presented from the perspective of experts in the implementation of digital technologies. In this paper, for the first time, the author's scheme is proposed that can allow not only providers, but also their customers to navigate the upcoming transition to the cloud. The latter will receive systematic information on how to select a contractor and the most economically feasible option of cooperation.
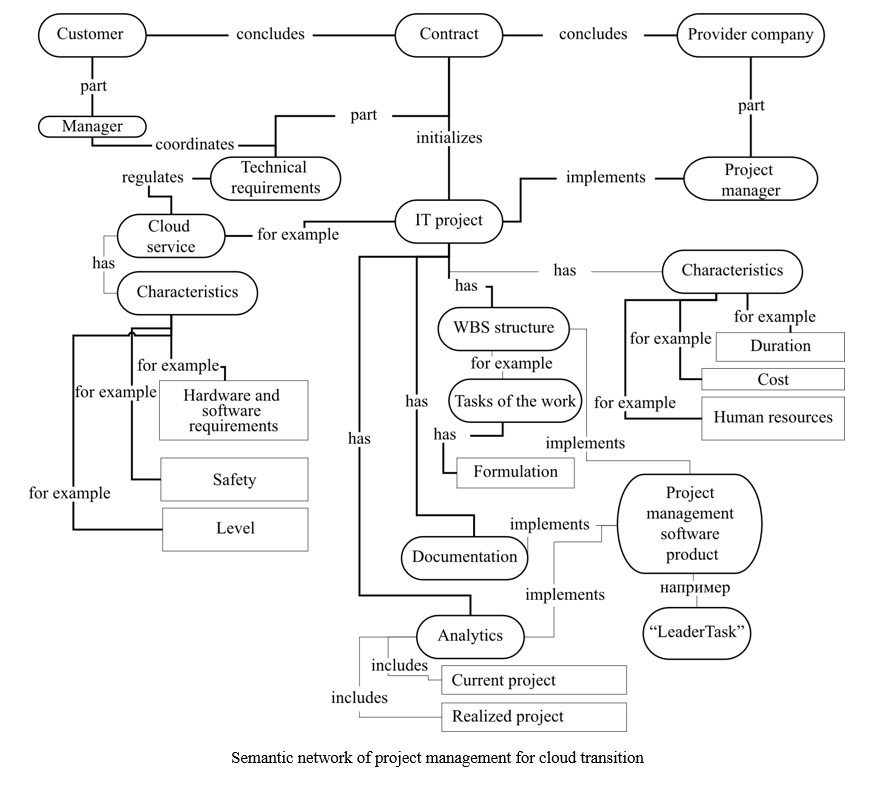
Materials and Methods. The information model was based on the semantic network as a system of nodes, their characteristics and connections. Management of the cloud migration project and the migration itself were visualized. The contraction practice between providers and their customers was summarized. The specifics of the tasks of such projects were taken into account. The part of the subject area related to the implementation of a cloud service is algorithmic — a step-by-step transition to the cloud, a generalized scheme of the process taking into account the hierarchy of elements are presented.
Results. For the first time, a method of self-preparation of a company for the implementation of cloud solutions is proposed. The algorithm systematizes the cloud migration processes. The activities related to goal setting, audit, selection of cloud environment and services, calculation of the economic efficiency of the project, planning and implementation of migration, technical support and scaling of processes are described. The possibilities of determining the economic feasibility of measures for the transition to the cloud are shown. The costs of equipment, data storage and processing, software licenses, salaries, information security, etc., are taken into account. The amount received is compared to the providers' offers. For the final decision, the costs of infrastructure support are taken into account — by the customer or the outsourcer. The best option is selected. As a result, the customer gets the opportunity to work with better profitability and scale the project. Feedback is provided, and processes are adjusted, starting with IT reaudit.
Discussion and Conclusion. The proposed solution will give the customer's management a system view of the execution sequence when migrating to the cloud, the issues and tasks to discuss with a potential outsourcer. Providers can use the algorithm to typify and unify projects, which can eventually simplify the coordination of the list of services and the migration procedure with customers. In this way, the parties can free up significant resources in terms of time, labor and other costs. In addition, customers and providers can partially use the described semantic network to develop not only the organizational, but also the technical aspect of the project.
Introduction. Computer vision is widely used for semantic segmentation of Earth remote sensing (ERS) data. The method allows monitoring ecosystems, including aquatic ones. Algorithms that maintain the quality of semantic segmentation of ERS images are in demand, specifically, to identify areas with phytoplankton, where water blooms— the cause of suffocation — are possible. The objective of the study is to create an algorithm that processes satellite data as input information for the formation and checking of mathematical models of hydrodynamics, which are used to monitor the state of water bodies. Various algorithms for semantic segmentation are described in the literature. New research focuses on enhancing the reliability of recognition — often using neural networks. This approach is modified in the presented work. To develop the direction, a new set of information from open sources and synthetic data are proposed. They are aimed at improving the generalization ability of the model. For the first time, the contour area of the phytoplankton population is compared to the database — and thus the boundary conditions are formed for the implementation of mathematical models and the construction of boundary-adaptive grids.
Materials and Methods. The set of remote sensing images was supplemented with the author's augmentation algorithm in Python. Computer vision segmented areas of phytoplankton populations in the images. The U-Net convolutional neural network (CNN) was trained on the basis of NVIDIA Tesla T4 computing accelerators.
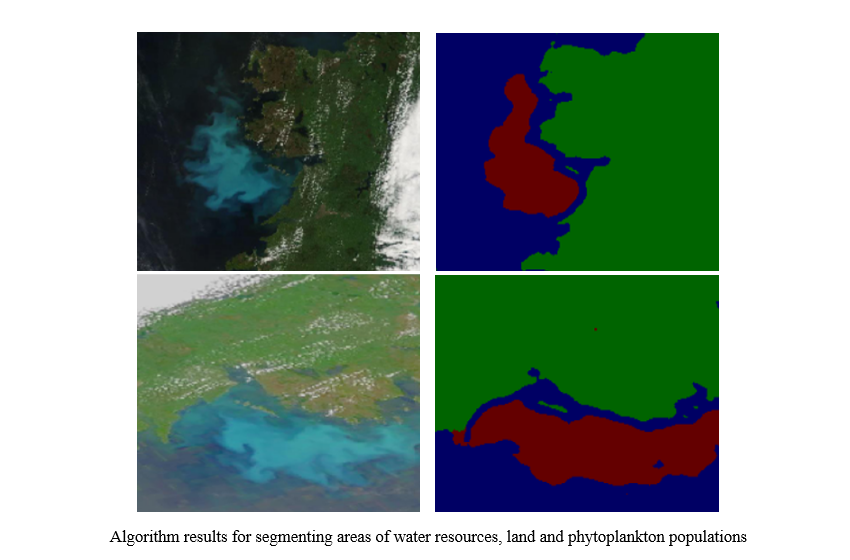
Results. To automate the detection of phytoplankton distribution areas, a computer vision algorithm based on the U-Net CNN was developed. The model was evaluated by the calculated values of the main quality metrics related to segmentation tasks. The following metric values were obtained: Precision = 0.89, Recall = 0.88, F1 = 0.87, Dice = 0.87, and IoU = 0.79. Graphical visualization of the results of CNN learning on the training and validation sets showed good quality of model learning. This is evidenced by small changes in the loss function at the end of training. The segmentation performed by the model turned out to be close to manual marking, which indicated the high quality of the proposed solution. The area of the segmented region of the phytoplankton population was calculated by the area of one pixel. The result obtained for the original image was 51202.5 (based on information about the number of pixels related to the bloom of blue-green algae). The corresponding result of the modeling was 51312.
Discussion and Conclusion. The study expands theoretical and practical knowledge on the use of convolutional neural networks for semantic segmentation of space imagery data. Given the results of the work, it is possible to assess the potential for automating the process of semantic segmentation of remote sensing data to determine the boundaries of phytoplankton populations using artificial intelligence. The use of the proposed computer vision model to obtain contours of water bloom due to phytoplankton will provide for the creation of databases — the basis for environmental monitoring of water resources and predictive modeling of hydrobiological processes.
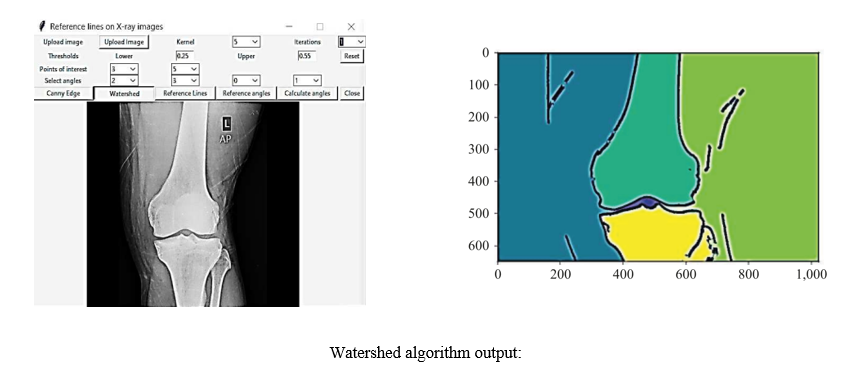
Introduction. To improve the diagnostics of knee joint diseases, it is necessary to enhance the quality of processing radiographic images, i.e., to provide experts with more accurate information for pathology analysis. The objective of the study is to demonstrate the capabilities of fuzzy logic in improving the algorithm for determining reference lines and knee flexion angles. This requires a program that analyzes X-ray images. The methods known today, described in scientific and applied literature, are not sufficiently automated. In some cases, orthopedists and surgeons have to manually refine images and adjust lines. This gap is filled by the presented work. The algorithm developed by the author is described. It does not involve human participation and automatically identifies the lines and angles of knee flexion. Based on the result issued by the system, the doctor can, firstly, judge the presence of pathology. Secondly, the information provided by the program allows for more accurate planning, performing operations, and prescribing therapy.
Materials and Methods. Images from two X-ray machines operating in Al-Basel Hospital (Latakia, Syria) were used. The Python language was used for the software implementation of the algorithm. The solution was tested on 500 patients at Al-Basel Hospital. The results generated by the new system and previous versions of X-ray image processing programs were compared.
Results. An algorithm for constructing reference lines and angles for processing knee joint X-ray images is created, described, and implemented in practice. The capabilities of fuzzy logic in automating double threshold detection when identifying bone boundaries in images are shown. The operation of an improved Gaussian filter designed for processing X-ray images is described. The modified method of knee bone X-ray analysis includes the development of an algorithm for automatic detection of structures and anomalies in knee joints, determination and measurement of anatomical parameters, assessment of the degree of damage, etc. The method for determining the contour boundaries on radiographs combined the Canny detector, the watershed algorithm, and fuzzy logic. The program has been implemented in medical practice and shows 98% accuracy, spending less than 20 seconds to process the image.
Discussion and Conclusion. The new system provides high accuracy, acceptable efficiency, and does not require manual correction of images. Experts are now able to identify subtle indicators of disorders. In addition, the new method makes it possible to understand complex cases when several factors are combined, indicating potential pathology. Widespread implementation of the method will improve the quality of medical services in orthopedics. Scientific research in this direction should be continued to expand the set of strategies for the treatment of diseases of the musculoskeletal system. It is necessary to create solutions with absolute accuracy, higher processing efficiency, as well as methods suitable for analyzing other joints.