Contents
Scroll to:
https://doi.org/10.23947/2687-1653-2024-24-3-215-226
EDN: KVEMQM
Scroll to:
Introduction. One of the reasons for undesirable delamination of polymer composites with fabric reinforcement is low transverse shear properties. It is known that the reinforcement of polymer fabric composites in the Z direction reduces the sensitivity to delamination and increases the viscosity of interlayer fracture. Various methods of three-dimensional reinforcement of polymer fabric composites are proposed in the literature. However, they complicate the manufacturing process of the structure. The problem is solved by the method of three-dimensional reinforcement proposed in this article — felting. This is a local reinforcement of the composite in the Z direction with minimal production changes. The degree of Z-reinforcement is determined by the felting density, i.e., the number of needle punches per 1 cm² of the fabric package. The work is aimed at evaluating the effect of felting on the interlayer crack resistance of a composite material.
Materials and Methods. The interlayer fracture toughness GIIc was determined on a cross-woven fiberglass with felting of 10 cm-². The material was impregnated with Etal-370 resin and Etal-45 hardener. Experiments according to ASTM D7905M–14 and GOST 33685–2015 standards were carried out on an Instron 5900R test machine. The stress state at the crack tip was analyzed with regard to the nonlocal strength theory in the ANSYS Workbench program (option “static strength analysis”). The finite element method (FEM) was used.
Results. The “load — displacement” curves were considered for the samples. Values GIIc were calculated. The results of ENF tests for felting density of 0 cm–² and 10 cm–² were summarized. Control samples and felting samples were compared. In the latter case, GIIс turned out to be ~33% higher. The stress state at the crack tip was calculated under DCB and ENF loading. The dependences of maximum normal and shear stresses, as well as displacements, were visualized in the form of graphs and color charts. To get the calculated “load — displacement” dependences using FEM, the reverse method of obtaining transverse shear constants was used. DCB loading showed that felting provided increasing the rupture strength in the Z direction to ~18%, by 39 to 46 MPa, and in the planes XZ— to ~16%, by 77 to 89 MPa.
Discussion and Conclusion. Felting as a method of local three-dimensional reinforcement enhances the interlayer crack resistance of polymer fabric composites. It provides reducing the area of stratifications after local impacts during the operation of structures. Flexible felting technology makes it possible to create zones with an arbitrary impact density, increasing fracture toughness only in the required places of structures. The FEM analysis of the stress state at the crack tip within the framework of the nonlocal strength theory has shown that in strength calculations, the stratification crack can be considered as a stress concentrator.
Forental G.А., Sapozhnikov S.B. Increasing the Interlayer Fracture Toughness of Polymer Fabric Composites Using Local 3D-Reinforcement (Felting). Advanced Engineering Research (Rostov-on-Don). 2024;24(3):215-226. https://doi.org/10.23947/2687-1653-2024-24-3-215-226. EDN: KVEMQM
Introduction. Fibrous polymer composites are widely used, in particular, in aviation and space engineering due to their significant rigidity and strength in the fiber orientation (plane XY) [1]. However, the transverse shear strength of these materials is quite low [2], as it is determined by the features of the polymer matrix [3]. Reinforcement of polymer fabric composites in the Z direction provides reducing the sensitivity to delamination, i.e., increasing the viscosity of interlayer fracture [4].
Various methods of three-dimensional reinforcement of polymer fabric composites are known [5]. However, they create additional difficulties in the manufacture of structures made of polymer fabric composites [6]. The method of three-dimensional reinforcement proposed in this work, felting [7], makes it possible to obtain a locally reinforced composite in the Z direction with minimal changes in the production process. The degree of Z-reinforcement is determined by the felting density, i.e., the number of needle punches per 1 cm2 of the area of the fabric package [8].
The use of various methods for determining the fracture toughness of polymer composite materials [9] makes it possible to conduct studies on various samples [10] and with different loading methods [11]. One of the most common approaches is the three-point bending method. In this case, a beam-shaped delamination sample is used. We are talking about ENF tests (End-Notched Flexure — bending of a sample with edge delamination) [12], which involve transverse shear loading. This makes it possible to determine the interlayer fracture viscosity of GIIc — mode II fracture. High shear stresses occur at the crack tip [13].
Another common way to determine transverse characteristics is the Double Cantilever Beam method (DCB tests). In DCB tests, the value of the interlaminar fracture toughness GIc is determined under separation loading — fracture according to mode I [14]. The delamination crack spreads due to the action of normal stresses [15].
The presented work was aimed at the evaluation of the effect of felting on the interlayer fracture toughness of a composite material. To do this, ENF tests (bending of a sample with an edge separation) of a composite material with increased crack resistance due to the use of felting were carried out. Previously, the authors studied the effect of felting on the interlayer crack resistance of a composite material during DCB tests [16]. A computational model based on the nonlocal theory of strength has been developed. It provides for the calculation of the stresses that occur in ENF and DCB samples, for cracks of various lengths, using the finite element method (FEM).
Materials and Methods
Experimental determination of interlayer crack resistance by the ENF method. The samples were made of cross-woven fiberglass with a layer thickness of 0.2 mm. A package of dry two-layered fiberglass was punched on a felting machine with a felting density of 10 cm–2 (10 punches with a felting machine needle per 1 cm2 of dry glass fabric). The fiberglass package was punched in such a way that after impregnation and hardening, the initial crack did not fall on the felting area. To create an initial crack between two layers of fiberglass, an aluminum foil with a thickness of 11 µm, coated with a Vs-M parting lubricant, was placed. Fiberglass was impregnated with resin Etal-370 and hardener Etal-45. For the production of reference samples, two layers of dry fiberglass were impregnated with Etal-370 resin and Etal-45 hardener without punching on a felting machine. After impregnation, plates from glass textolite STEF (electrotechnical glass-cloth-base laminate) were glued to two layers of fiberglass (Fig. 1 a). Samples with a length of 150 mm and a width of 16 mm were obtained by cutting the hardened plates using a high-speed circular saw.
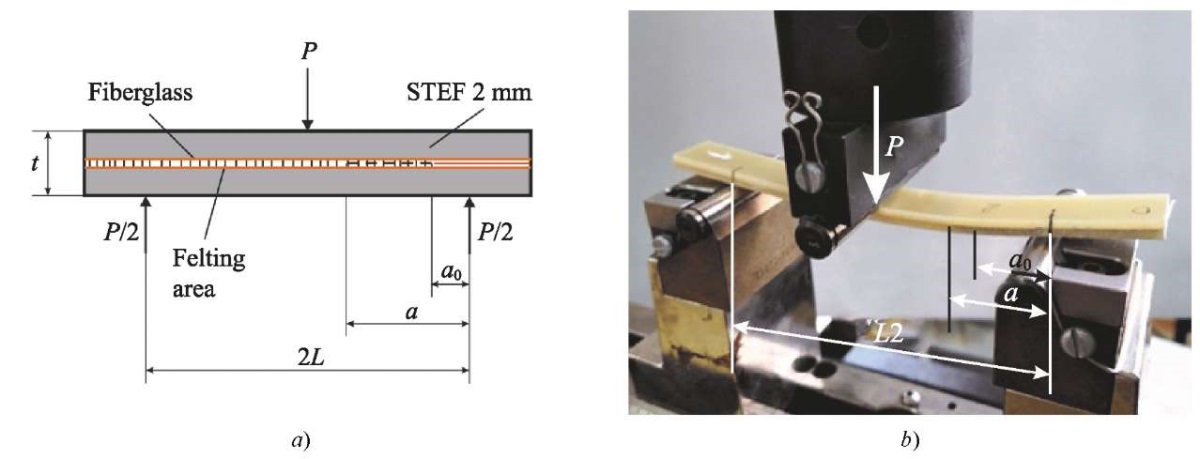
Fig. 1. Configuration and parameters of ENF tests according to mode II:
a — loading scheme; b — photo of tests
The Instron 5900R test machine with a loading speed of 10 mm/min was used. The distance between the supports was 2L = 100 mm. The initial crack length for all samples was a0 = 25 mm. To perform compliance calibration over a wide range of crack lengths, one sample of each type was unloaded and reloaded. The resulting crack served as the initial crack in the next loading cycle.
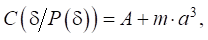
Calibration recommended by ASTM D7905M–141 and GOST 33685–20152 standards was used to process the test results. This approach provided determining parameters А and m for each felting sample and each non-felting control sample from the linear dependence of two quantities — compliance of sample and cube of the crack length а³:
 (1)
(1)
where Р — load applied to the sample; d — displacement.
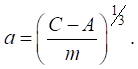
After calibration and determination of parameters А and m, the crack length can be found from expression (1):
 (2)
(2)
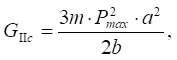
The moment of the delamination onset is determined by the condition C(d) = C(Pmax). Value of the interlayer fracture toughness at the separation onset (crack development):
 (3)
(3)
where Pmax — maximum load; a — crack length calculated by formula (2) at load Pmax; b — sample width.
Calculation of the stress state at the crack tip under loading according to the DCB and ENF schemes. The stress state of a crack-like concentrator is estimated from the perspective of approaches that use nonlocal stresses [17], i.e., averaged on some basis [18]. The calculation model also includes the assumption of linear-elastic behavior of the material up to destruction [16].
The main hypothesis is that the strength criterion of the composite, which includes all components of stress averaged on the basis l, is responsible for the development of a crack-like concentrator (Fig. 2):
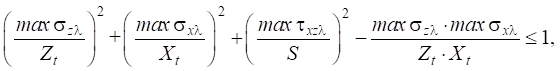 (4)
(4)
where Zt and Xt — rupture strength in the Z and X directions; S — shear strength in the plane XZ.
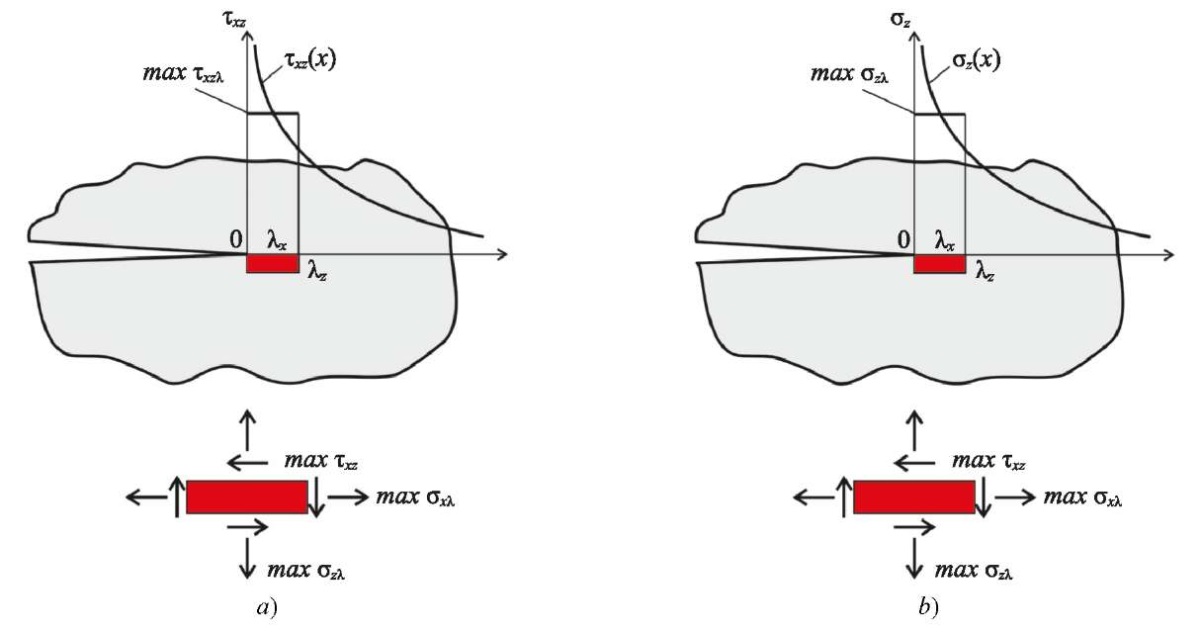
Fig. 2. Stresses averaged on the basis l at the crack tip:
a — ENF tests; b — DCB tests
Due to the presence of symmetry planes, a three-dimensional 1/2 crack sample model was constructed for ENF loading (Fig. 3), and 1/4 crack sample — for DCB tests (Fig. 4). Calculations were performed in the ANSYS Workbench program (option “static structural”).
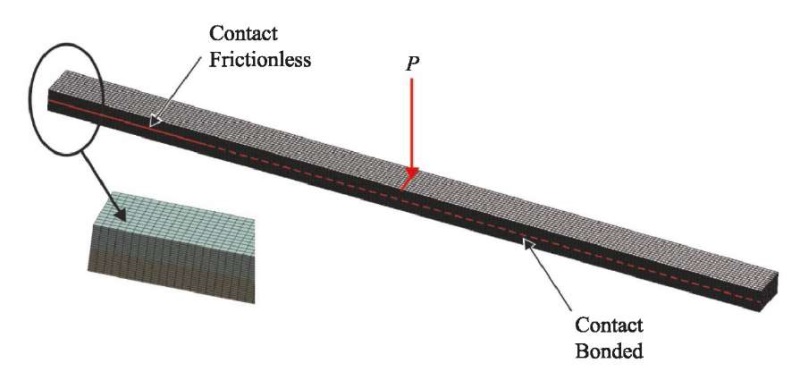
Fig. 3. Finite element model 1/2 of the sample and a fragment of the grid for ENF tests
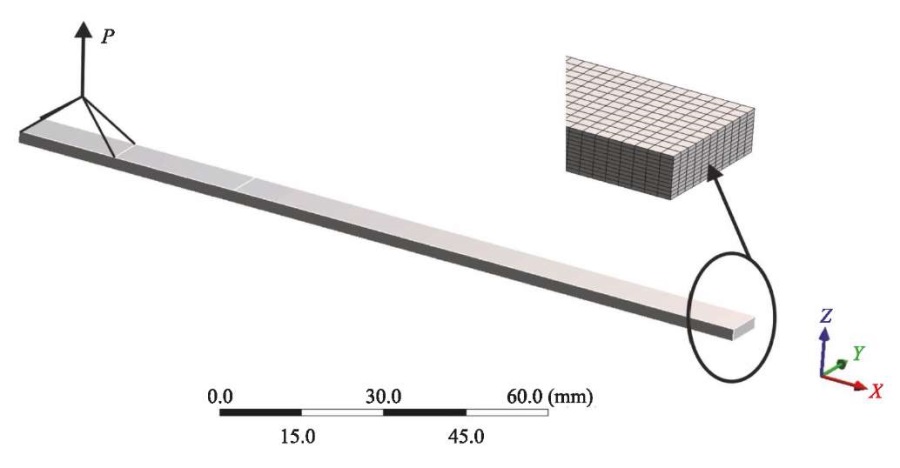
Fig. 4. Finite element model 1/4 of the sample and a fragment of the grid for DCB tests
When creating the finite element grid, parameter lx = 0.75 mm in width of the sample [19] and parameter lz = 0.2 mm in thickness of the sample were set, which corresponded to the thickness of the modified layer [20]. One finite element in the thickness of the layer was set in accordance with the layer wise theory used in assessing the strength of layers within the framework of mesomechanics of composites [21]. In ENF tests, the total displacements in the sample were much greater than the local displacements from the loading roller (Fig. 1 b); therefore, the grid of finite elements was not condensed at the places of application of loads and supports (Fig. 3). Properties of fiberglass used in the calculation:
Since the volume fraction of transverse reinforcement is less than 1% [16], it is assumed in the calculations that the elastic properties of fiberglass do not change under felting.
Dependence P(d) was calculated in accordance with the sequence described below.
Research Results
Results of the experimental determination of interlayer fracture toughness by the ENF method. Figure 5 shows the “load — displacement” curves for all tested samples. All “load — displacement” curves have an area with constant compliance (Clin), corresponding to the linear “load — displacement” ratio. Values Clin were used for calibration.
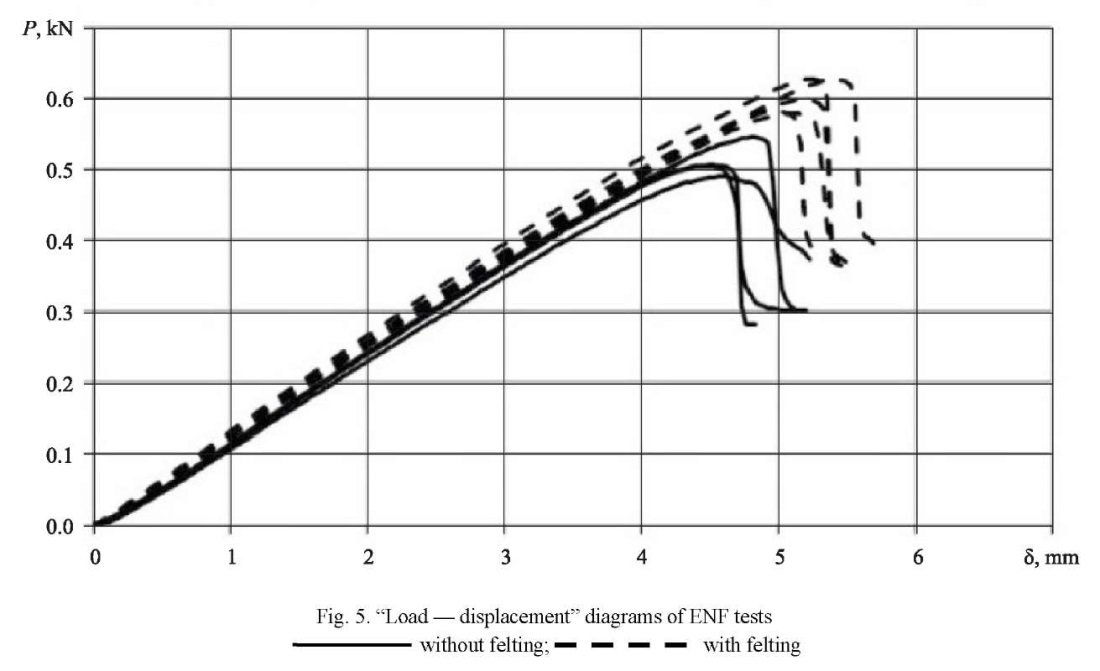
Figure 6 shows the calibration curves. For felting and non-felting samples, compliance is proportional to the cube of the crack length.
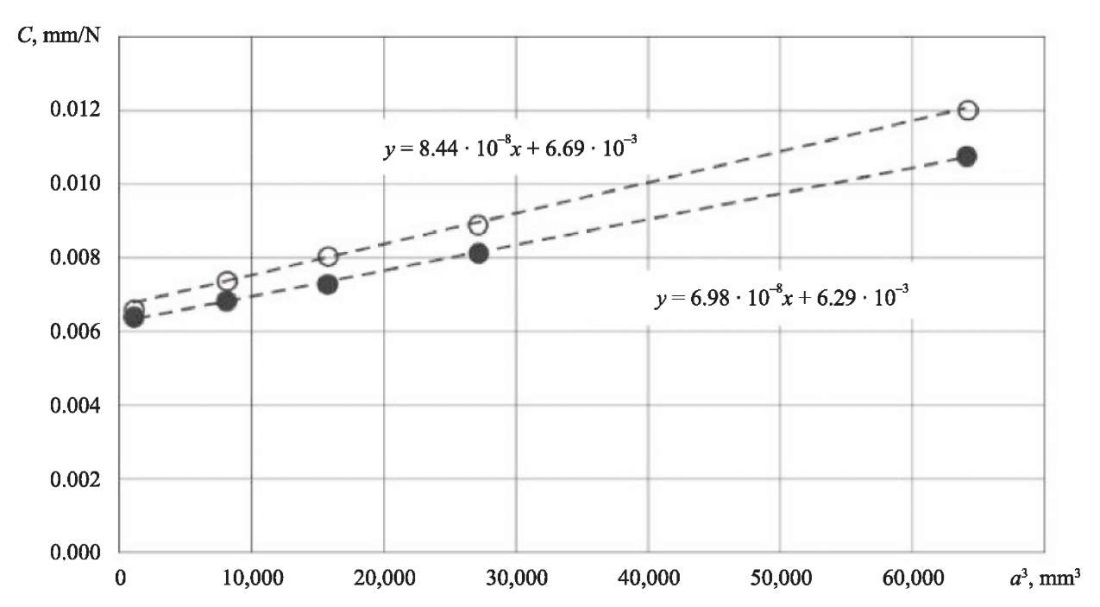
To calculate values of the crack length a*, corresponding to the compliance at the delamination onset C(Pmax), the obtained calibration curves and equation (2) were used. For the found values of the crack length a*, values GIIс were calculated using equation (3). The results are shown in Table 1.
Table 1
ENF Test Results
|
Felting Density, cm–2 |
а0, mm |
Clin, mm/N |
C(Pmax), mm/N |
a*, mm |
Pmax, N |
GIIc, kJ/m2 |
GIIc (average value), kJ/m2 (CV) |
|
0 |
25 |
8.032 |
8.845 |
29.4 |
504.6 |
1.723 |
1.840 ± 0.126 (6.9%) |
|
0 |
25 |
7.980 |
8.807 |
29.3 |
544.6 |
1.983 |
|
|
0 |
25 |
8.299 |
9.392 |
31.7 |
489.4 |
1.908 |
|
|
0 |
25 |
7.905 |
8.900 |
29.7 |
505.2 |
1.746 |
|
|
10 |
25 |
7.587 |
8.337 |
30.8 |
627.3 |
2.432 |
2.441 ± 0.154 (6.3%) |
|
10 |
25 |
7.849 |
8.677 |
32.4 |
625.8 |
2.682 |
|
|
10 |
25 |
7.937 |
8.811 |
33.0 |
578.4 |
2.376 |
|
|
10 |
25 |
7.824 |
8.594 |
32.1 |
581.4 |
2.261 |
|
|
10 |
25 |
7.880 |
8.818 |
33.1 |
589.3 |
2.456 |
* variation coefficient
Felting samples showed a significant (by ~33%) increase in the interlayer fracture toughness GIIс compared to the control samples. After testing, felting samples were separated with a sharp knife and examined under a microscope. Micrographs of the zone without felting (area of the initial crack) and the zone with felting (area of crack development) are shown in Figure 7. When cracks develop, the fibers elongated during felting are destroyed, because their length is greater than the critical one [16].
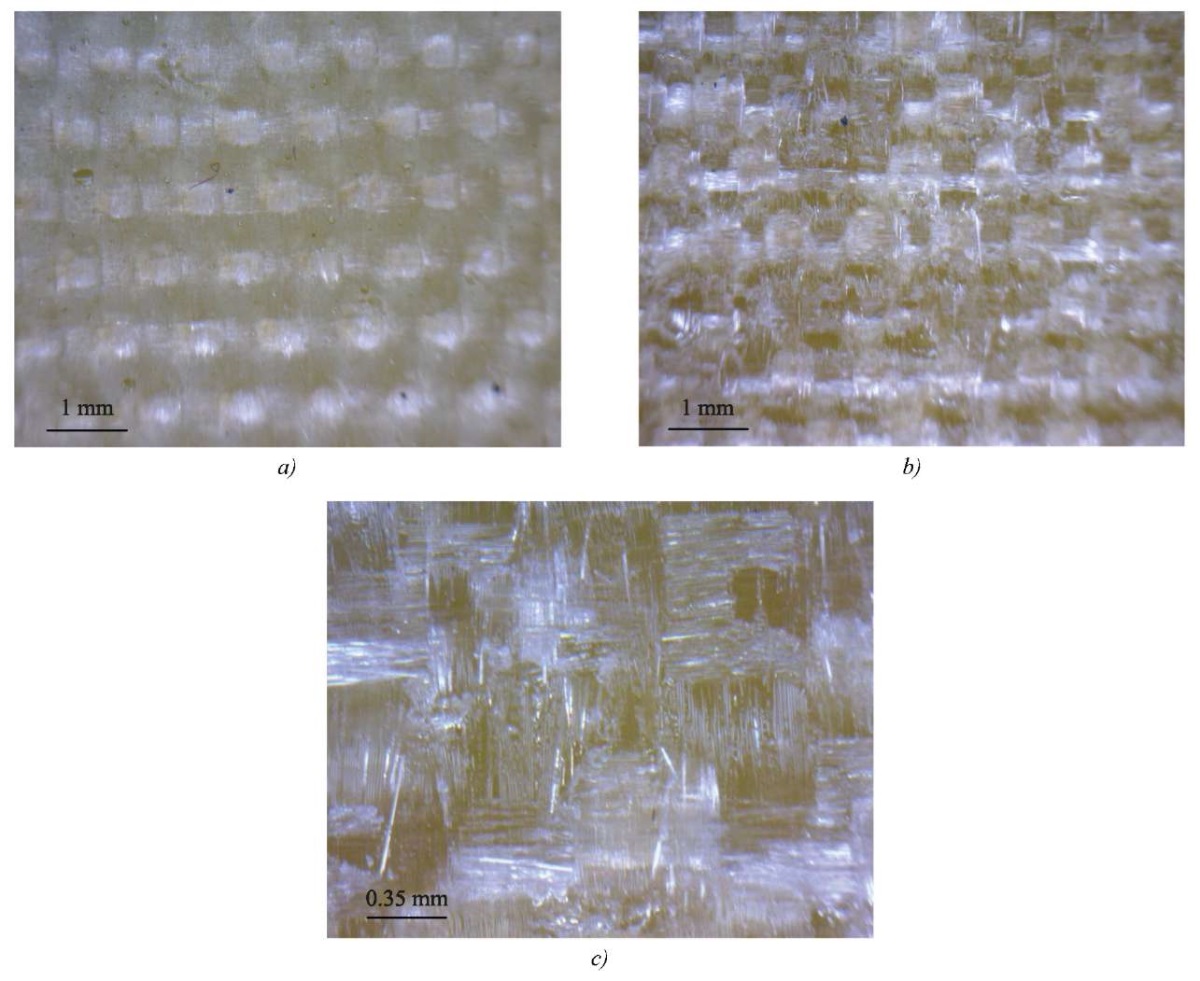
Fig. 7. Micrographs of felting samples after ENF tests:
a — zone without felting (area of initial crack);
b — zone with felting (area of crack development);
c — zone with felting (enlarged scale)
Results of the calculation of the stress state at the crack tip under loading according to the DCB and ENF schemes. Figures 8–9 show the dependences of stress maxσzλ(a), maxσxλ(a), maxτxzλ(a) and displacements d(a). Conditions: P = 1 N, loading according to DCB and ENF schemes.
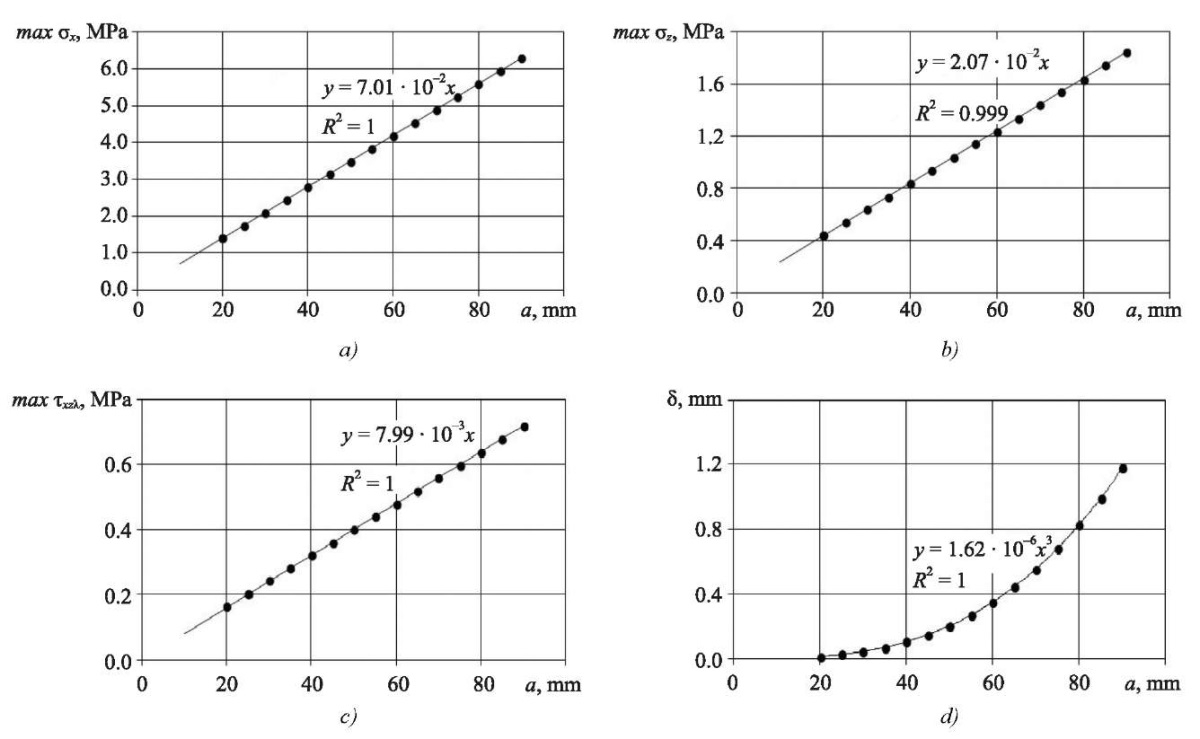
Fig. 8. DCB-loading. Dependences of maximum stresses and displacements
of the crack length at Р = 1 N:
a— dependence of normal stresses maxσxλ(a);
b — dependence of normal stresses maxσzλ(a);
c — dependence of shear stresses maxτxzλ(a);
d — dependence of displacements d(a)
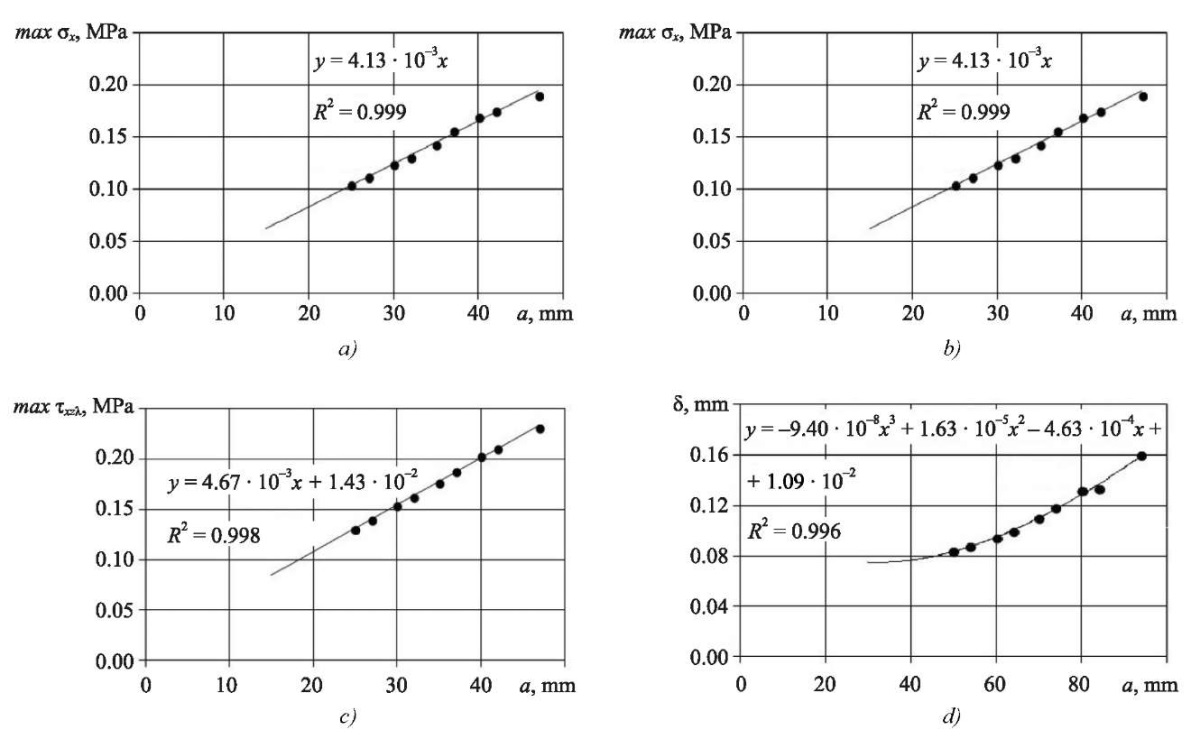
Fig. 9. ENF- loading. Dependences of maximum stresses and displacements
of the crack length at Р = 1 N:
a — dependence of normal stresses maxσxλ(a);
b — dependence of normal stresses maxσzλ(a);
c — dependence of shear stresses maxτxzλ(a);
d — dependence of displacements d(a)
Examples of stress distribution at the crack tip are shown in Figures 10–11 with crack length a0 = 30 mm.
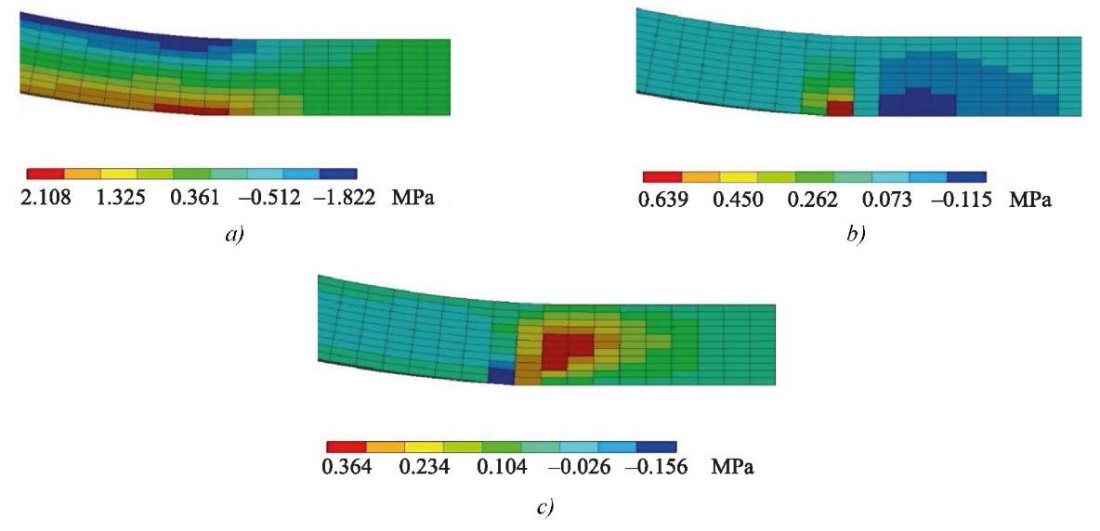
Fig. 10. Stresses at the crack tip under DCB loading:
a — normal stresses σxλ; b — normal stresses σzλ; c — shear stresses τxzλ
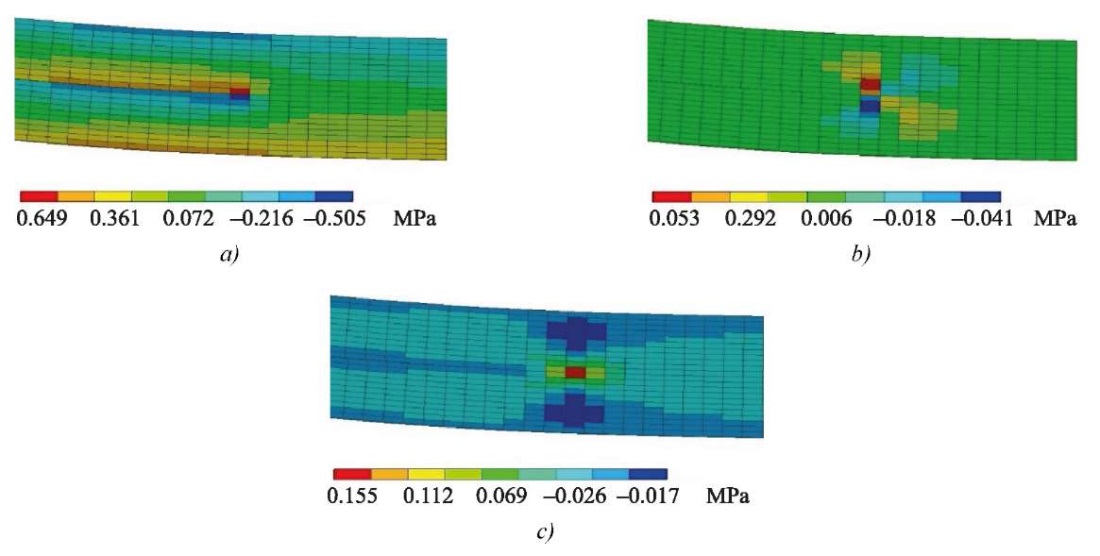
Fig. 11. Stresses at the crack tip under ENF loading:
a — normal stresses σxλ; b — normal stresses σzλ; c — shear stresses τxzλ
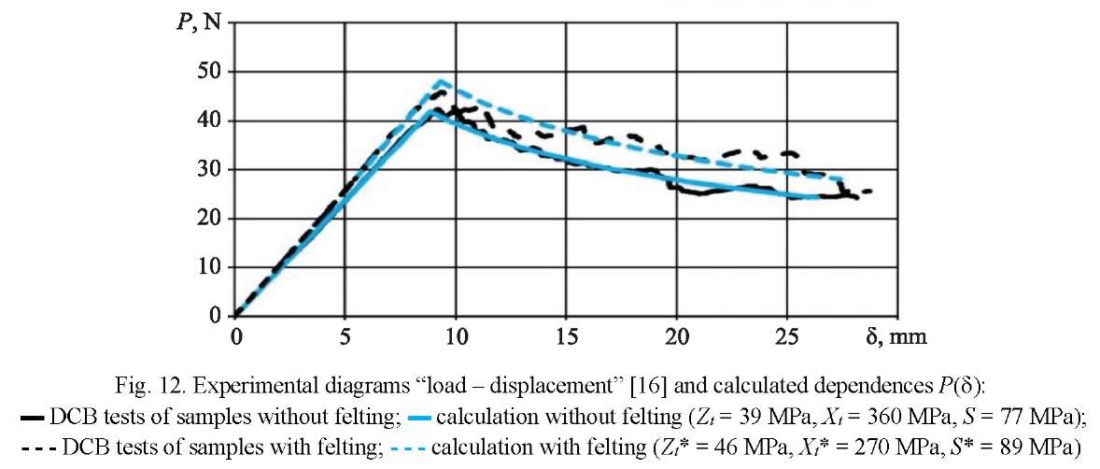
To obtain the calculated “load — displacement” dependences using FEM, the strength characteristics of the composite in the main directions are taken into account, i.e., criterion (4). Direct obtaining of transverse shear constants involves a certain difficulty; therefore, the reverse method is considered below. With this approach, the constants vary, and their best combination is found. This means that the calculated and experimental loading diagrams are in good agreement (mean square deviation of displacements at specified loads is minimal).
The results of the calculation under loading according to the DCB scheme were compared to the authors' experiment, which was considered in [16]. Samples were made in the same way. The tests were carried out in accordance with GOST R 56815–20153 and ASTMD5528–144 standards.
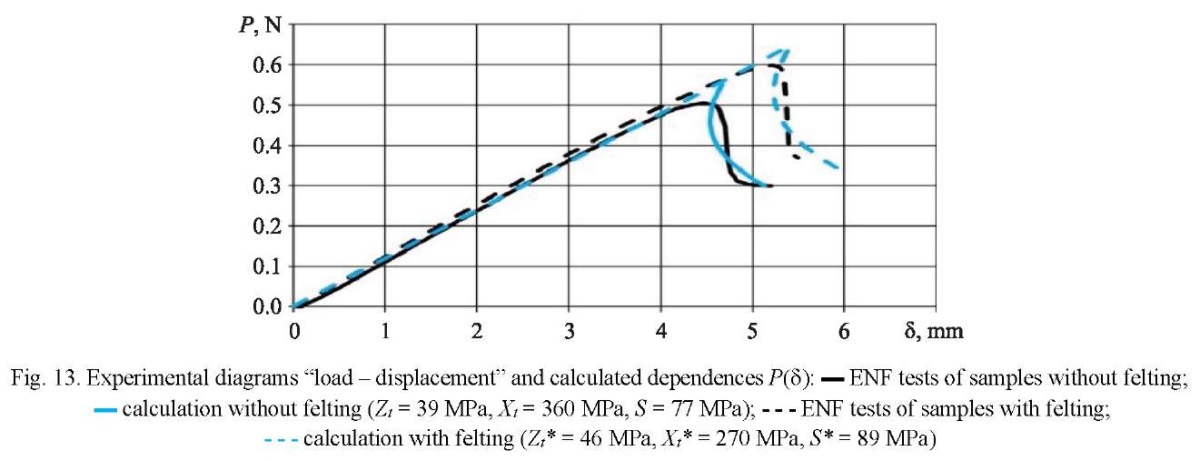
The calculation was performed for loading according to the DCB scheme. When calculating dependence P(d) for samples without felting, the following stress limits were found and rounded to integer values: Zt = 39 MPa, Xt = 360 MPa, S = 82 MPa. The obtained values 360 MPa and 39 MPa correspond to the data on the strength of fiberglass specified in [23]. For felting samples (density 10 cm-2), the calculated values were Xt* = 270 MPa, Zt* = 46 MPa and S* = 97 MPa. Thus, the use of felting made it possible to increase the rupture strength in the Z direction from 39 to 46 MPa (by ~18%).
When loading according to the DCB scheme, the shear strength limits in the plane XZ S and S* do not make a big contribution to criterion (4); therefore, values S = 82 MPa and S* = 97 MPa obtained in calculations according to the DCB scheme need to be clarified according to the ENF loading scheme. Note that the effect of normal stresses in the X and Z directions is insignificant compared to shear stresses under loading according to the ENF scheme. Therefore, in the calculations, when searching for the values S and S*, values Zt, Xt, Zt* and Xt* were taken from solving the inverse problem under loading according to the DCB scheme.
Values S = 77 MPa (without felting) and S* = 89 MPa (with felting) were determined from the condition of the best consistency of the experimental and calculated curves P(d) (mean square deviation of displacements at given loads is minimal). Evidently, felting made it possible to increase the shear strength in the plane XZ by ~16%.
Figures 12–13 show the experimental “load — displacement” diagrams, as well as calculated dependences P(d) for the found values of stress limits:
Discussion and Conclusion. Studies of the fabric composite have shown that felting with a density of 10 cm–2 increases the viscosity of the interlayer fracture GIIc by ~33%.
Using FEM, the stress state was analyzed in a quasi-static elastic formulation of the problem and with a nonlocal strength theory for the developed numerical models of a beam with cracks of the known length. The distinctive feature of the calculations was that they did not use contact algorithms, but only considered the destruction of the composite layer closest to the crack, and the corresponding change in the area of gluing the layers. That is, the crack was considered as a stress concentrator. The composite strength criterion, which contained three parameters and was recorded through averaged stresses, provided using the method of step-by-step crack advancement to predict the “load — displacement” curve.
The use of felting with a density of 10 cm–2 increases the stress limit of the composite in the Z direction by ~18%, and the shear strength in the plane XZ — by ~16%. This became known from solving the inverse problem, i.e., searching for the strength characteristics of the material according to criterion (4) and the “load — displacement” curve.
The results of the presented research will find their practical application. They can be specifically used in problems of forecasting defects, such as delamination (e.g., in low-speed impacts on composites in aircraft skin). The research results will be useful for eliminating these defects with the help of felting.
1. ASTM D7905/D7905M–14. Standard Test Method for Determination of the Mode II Interlaminar Fracture Toughness of Unidirectional Fiber-Reinforced Polymer Matrix Composites. URL: https://cdn.standards.iteh.ai/samples/89096/03be6b5e53664f13a8703bb4342d981a/ASTM-D7905-D7905M-14.pdf (accessed: 22.04.2024).
2. GOST 33685–2015. Polymer Composites. Test Method for Determination of the Interlaminar Fracture Toughness under Shear. (In Russ.) URL: https://docs.cntd.ru/document/1200127774 (accessed: 22.04.2024).
3. GOST R 56815–2015. Polymer Composites. Method for Determination Specific Work of Exfoliation in Tearing Off Conditions. (In Russ.) URL: https://docs.cntd.ru/document/1200131393/titles (accessed: 22.04.2024).
4. ASTMD5528M–21. Standard Test Method for Mode I Interlaminar Fracture Toughness of Unidirectional Fiber-Reinforced Polymer Matrix Composites. https://doi.org/10.1520/D5528_D5528M-21
1. Callister WD Jr., Rethwisch DG. Materials Science and Engineering: An Introduction. 10th edn. Hoboken, NJ: Wiley; 2018. 992 p. URL: https://www.wiley.com/en-us/Materials+Science+and+Engineering%3A+An+Introduction%2C+10th+Edition-p9781119405498 (accessed: 22.04.2024).
2. Wei Tan, Falzon BG, Chiu LNS, Price M. Predicting Low Velocity Impact Damage and Compression-After-Impact (CAI) Behaviour of Composite Laminates. Composites Part A: Applied Science and Manufacturing. 2015;71:212–226. https://doi.org/10.1016/j.compositesa.2015.01.025
3. Balasubramani Veerappan, S Rajendra Boopathy. Prediction of Residual Tensile Strength of Laminated Composite Plates after Low Velocity Impact. ARPN Journal of Engineering and Applied Sciences. 2014;9(3):320–325.
4. Abrate S. Impact on Composite Structures. Cambridge: Cambridge University Press; 2009. 289 p. https://doi.org/10.1017/CBO9780511574504
5. Liyong Tong, Mouritz AP, Bannister MK. 3D Fibre Reinforced Polymer Composites. Amsterdam: Elsevier Science; 2002. 254 p. https://doi.org/10.1016/B978-0-08-043938-9.X5012-1
6. Jinlian Hu. 3-D Fibrous Assemblies: Properties, Applications and Modeling of Three-Dimensional Textile Structures. Sawston, Cambridge: Woodhead Publishing; 2008. 280 p.
7. Chen Xiaoming, Zhao Yufen, Zhang Chunyan, Wang Xiaoxu, Chen Li. Robot Needle-Punching for Manufacturing Composite Performs. Robotics and Computer-Integrated Manufacturing. 2018;50:132–139. https://doi.org/10.1016/j.rcim.2017.09.008
8. Forental GA, Kheruvimov AV, Nikonov AV, Sapozhnikov SB. Stack Fabric Felting to Get PCM Gllc Improvement and LVI Tolerance. IOP Conference Series: Materials Science and Engineering. 2021;1024(1):012001. https://doi.org/10.1088/1757-899X/1024/1/012001
9. Sham MS, Venkatesha CS, Jayaraju T. Experimental Methods of Determining Fracture Toughness of Fiber Reinforced Polymer Composites under Various Loading Conditions. Journal of Minerals and Materials Characterization and Engineering. 2011;10(13):1263–1275. http://doi.org/10.4236/jmmce.2011.1013099
10. Pinho S, Robinson P, Iannucci L. Developing a Four Point Bend Specimen to Measure the Mode I Intralaminar Fracture Toughness of Unidirectional Laminated Composites. Composites Science and Technology. 2009;69(7–8): 1303–1309. https://doi.org/10.1016/j.compscitech.2009.03.007
11. Issam Tawk, Jihad Rishmany, Nicolas Saba, Pablo Navarro, Jean-Francois Ferrero. Experimental Study of the Interlaminar Fracture of Composite Materials in Mode III by MSCB Test. Composite Structures. 2020;233:111548. https://doi.org/10.1016/j.compstruct.2019.111548
12. Hossein Saidpour, Mehdi Barikani, Multu Sezen. Mode-II Interlaminar Fracture Toughness of Carbon/Epoxy Laminates. Iranian Polymer Journal. 2003;12(5):389–400.
13. Sham Prasad MS, Venkatesha CS, Jayaraju T. Experimental Methods of Determining Fracture Toughness of Fiber Reinforced Polymer Composites under Various Loading Conditions. Journal of Minerals and Materials Characterization and Engineering. 2011;10(13):1263–1275. http://doi.org/10.4236/jmmce.2011.1013099
14. Ying Zeng, Hong-Yuan Liu, Yiu-Wing Mai, Xu-Sheng Du. Improving Interlaminar Fracture Toughness of Carbon Fibre/Epoxy Laminates by Incorporation of Nano-Particles. Composites Part B: Engineering. 2012;43(1):90–94. https://doi.org/10.1016/j.compositesb.2011.04.036
15. Kadhum A, Muslim ZR, Jaffer HI. Interlaminar Fracture of Micro and Nano Composites Special. Acta Physica Polonica: Series A. 2019;135(5):1126–1128. http://doi.org/10.12693/APhysPolA.135.1126
16. Forental GA, Sapozhnikov SB. Prospects of Felting Technology for Local 3D-Reinforcement of Polymer Fabric Composites. Composites and Nanostructures. 2022;14(56):233–245. https://doi.org/36.10236/1999-7590-2022-14-4-233-245233
17. Maimi P, Gonzalez EV, Gascons N, Ripoll L. Size Effect Law and Critical Distance Theories to Predict the Nominal Strength of Quasibrittle Structures. Applied Mechanics Reviews. 2013;65(2):020803. https://doi.org/10.1115/1.4024163
18. Hoang Thai Nguyen, A Abdullah Dönmez, Zdenek P Bazant. Structural Strength Scaling Law for Fracture of Plastic-Hardening Metals and Testing of Fracture Properties. Extreme Mechanics Letters. 2021;43(1):101141. https://doi.org/10.1016/j.eml.2020.101141
19. Taylor D. The Theory of Critical Distances: A New Perspective in Fracture Mechanics. Amsterdam: Elsevier Science; 2007. 306 p. https://doi.org/10.1016/B978-0-08-044478-9.X5000-5
20. Mahmoodi MJ, Khamehchi M. Finite Element Analysis of Free Corner Effects in Composite Laminates Based on a Global–Local Model. Archive of Applied Mechanics. 2023;93(12):4327–4350. http://doi.org/10.1007/s00419-023-02494-1
21. Jaehong Lee, Zafer Gurdal, O Hayden Griffin Jr. Layer-Wise Approach for the Bifurcation Problem in Laminated Composites with Delaminations. AIAA Journal. 1993;31(2):331–338. https://doi.org/10.2514/3.11672
22. Sapozhnikov SB. Failure of Fabric Reinforced Composite with Concentrators: Implementation of Inelastic Deformation in Numerical Simulation. Composites and Nanostructures. 2020;12(45):31–39. https://doi.org/10.36236/1999-7590-2020-12-2-31-39
23. Barbero EJ. Introduction to Composite Materials Design, 2nd ed. Boca Raton: CRC Press; 2011. 562 p. https://doi.org/10.1201/9781439894132
Galina A. Forental, Research Engineer
76, Lenin Ave., Chelyabinsk, 454080
Sergey B. Sapozhnikov, Dr.Sci. (Eng.), Professor of the Engineering Mechanics Department; Leading Scientist
76, Lenin Ave., Chelyabinsk, 454080
1, Zhukovsky Str., Zhukovsky, Moscow Region, 140180
Forental G.А., Sapozhnikov S.B. Increasing the Interlayer Fracture Toughness of Polymer Fabric Composites Using Local 3D-Reinforcement (Felting). Advanced Engineering Research (Rostov-on-Don). 2024;24(3):215-226. https://doi.org/10.23947/2687-1653-2024-24-3-215-226. EDN: KVEMQM


Advanced Engineering Research (Rostov-on-Don)
ISSN 2687-1653 (Online)
Contact with: Publisher / Editorial Office of the Journal
Publisher: Don State Technical University - DSTU, Rostov-on-Don, Russia - https://donstu.ru/en/
Editor-in-Chief: Alexey N. Beskopylny, Dr.Sci. (Eng.), Professor, Vice-Rector, Don State Technical University (Rostov-on-Don, Russia)
Don State Technical University
1, Gagarin Sq., Rostov-on-Don, 344003, Russia
tel.: +7 (863) 2738-372, e-mail: vestnik@donstu.ru
16+
Processing of personal data