Contents
Scroll to:
https://doi.org/10.23947/2687-1653-2024-24-4-307-315
EDN: RMBTZU
Scroll to:
Introduction. Acoustic anisotropy is measured during ultrasonic nondestructive testing. It estimates the magnitude of stresses by the acoustoelasticity method. The literature describes in detail the application of this approach in the case of a biaxial strength of extended structures: main pipelines, rail strings, steam generators, and others. They assume the presence of a uniform field with zero or weak gradients of stresses and deformations. However, the problem of timely detection and assessment of critical stresses caused by local concentrators through ultrasonic testing has not been solved. The presented material is intended to fill this gap. The work is aimed at determining the possibilities of the acoustoelasticity method to estimate the difference in the main biaxial stresses around the concentrator — a circular cutout in a rectangular plate.
Materials and Methods. A 510×120×15 mm plate with a central hole of 40 mm in diameter was cut from a sheet of commercial-purity aluminum of the AMc brand (AW-3003 according to ISO) across the rolling direction, and subjected to uniaxial step loading in an Instron-8850 testing machine. For ultrasonic measurements, an acoustic sensor with a carrier frequency of 5 MHz was used. The stresses were calculated by solving the problem of stretching an isotropic linear-elastic plate in the ANSYS finite element modeling package and by the relations of the plane Kirsch problem obtained in the polar coordinate system.
Results. The research allows us to state that the results of analytical and numerical calculations largely coincide only for points located near the zone of greatest stress concentration. In all other cases, the indicators differ several times in sign and modulus. The difference is explained by the fact that Kirsch's approach assumes the action of compressive stresses in the area of location of some points, but this factor is absent if we are talking about a real plate. It has been established that in the area of material with predominant tensile stresses, the acoustoelasticity method allows for a quantitative estimate of their difference with an error not exceeding the engineering one. Calculations based on the Kirsch relations correlate with the others only at points with the maximum concentration of tensile stresses.
Discussion and Conclusion. The results of the study provide applying the acoustoelasticity method to estimate the magnitude of tensile biaxial stresses in the area around the fabrication holes. They are consistent with well-known scientific results and make it possible to rationally select the measurement points of acoustic anisotropy. The results of this scientific work can be applied in ultrasonic non-destructive testing using the acoustoelasticity method.
Tretyakov D.A., Osovik D.S. Estimation of Stresses in a Plate with a Concentrator through Ultrasonic Measurements of Acoustic Anisotropy. Advanced Engineering Research (Rostov-on-Don). 2024;24(4):307-315. https://doi.org/10.23947/2687-1653-2024-24-4-307-315. EDN: RMBTZU
Introduction. In recent decades, domestic nondestructive testing technologies have been developed to determine the stress-strain state of elements of energy systems, railway and pipeline transport [1]. These approaches involve solving inverse problems in the case of a nonuniform stress state [2], noncontact electromagnetic acoustic strain measurement [3], taking into account the degradation of elastic properties in combined nondestructive testing [4], as well as precision measurement of time delays in the propagation of elastic waves in the material [5]. The technologies have been verified in industrial measurements1 [6], their application is accompanied by the operation of modern diagnostic equipment [7]. However, the task of testing existing approaches in the diagnostics of anisotropic structural materials, which include industrial rolled products, remains relevant [8].
This work is devoted to the study of acoustic anisotropy [9] of an initially inhomogeneous material. In this case, it is commercially pure aluminum of the AMc brand (AW-3003 according to ISO). Samples cut from a rolled sheet were not prepared to remove the initial internal stresses caused by plastic deformation during rolling [10]. The task is to establish the possibility of estimating the difference in the magnitude of biaxial stresses in a metal with inhomogeneous initial acoustic anisotropy [11].
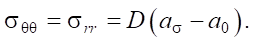
Materials and Methods. In the experiments, we used the IN-5101A ultrasonic acoustic anisotropy analyzer2. This is a certified device for measuring mechanical stresses by the acoustoelasticity method [12]. The stresses were calculated from the formula:
 (1)
(1)
Here, σθθ and σrr — principal components of the stress tensor in polar coordinates, D — coefficient of elastic-acoustic coupling of the material; a0 — initial acoustic anisotropy at the measurement point; aσ — value of the acoustic anisotropy parameter under the current value of the uniaxial tensile load σ. For the aluminum alloy AMc, coefficient D = –2.0 ± 0.3 ∙ 10–4MPa [13].
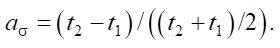
The current value of the acoustic anisotropy parameter aσ [14] was determined from formula (2) as the relative difference in the propagation time of transverse ultrasonic waves of mutually orthogonal polarization [15]:
 (2)
(2)
Here, t1, t2 — current values of time delays during the passage of transverse wave packets through the thickness of the material after their multiple reflection, whose velocities are directed along and across the line of uniaxial loading.
The measurements were performed using acoustic sensors with a pulse emission frequency of 5 MHz. The accuracy of the measurements of time delays t1, t2 was 3 ns.
The low-alloy corrosion-resistant aluminum-manganese alloy of the AMc brand, close in its properties to commercially pure aluminum (97/99% Al in composition), was studied. Aluminum was a model material for ultrasonic research. It was with it that the basic results in the acoustoelasticity were obtained [1].
Mechanical tests were performed on a 510×120×15 mm rectangular plate, cut from a rolled aluminum sheet across the rolling direction. The sample had a stress concentrator in the form of a central circular hole with a diameter of 40 mm (Fig. 1).

Fig. 1. Diagram of a sample from a sheet of rolled aluminum grade AMc
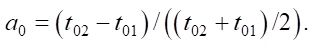
The direction of rolling affects the sign of the initial acoustic anisotropy a0 [16]:
 (3)
(3)
Here, t01, t02 — initial time delays of transverse waves. In the case of samples cut across the rolled product, the dimensionless parameter of the initial acoustic anisotropy , calculated from formula (3), is negative: a0 < 0.
For rigid step loading of the plate, uniaxial tension was applied in an Instron-8850 hydraulic machine (Fig. 3). The stress-strain state was considered at three loading stages with tensile load values F1 = 30 kN, F2 = 50 kN and F3 = 70 kN. For the study, n = 8 sections (points) of the sample were selected. The diagram of their location is shown in Figure 2.
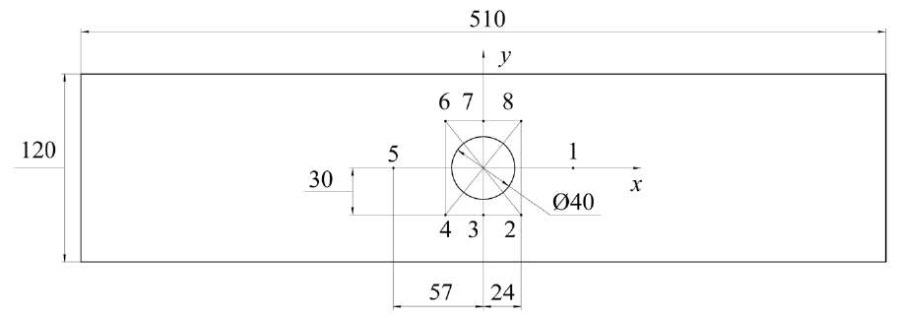
Fig. 2. Layout of the sample points under study
Ultrasonic testing was performed along three rows of points: 1–5, 2–4 and 6–8, symmetrically located relative to each other around the stress concentrator (Fig. 2). The characteristic size of the plates of the piezoelectric elements of the acoustic sensor was 12×12 mm. That means that each point was associated with its own local representative volume of material. The points were selected so that the representative volumes differed significantly in their stress-strain state [17].
Mechanical tensile testing in an Instron-type machine involved different boundary conditions for the sample. Its lower part (points 4–6 in Figure 2) was rigidly fixed in a stationary grip of the testing machine (Fig. 3). In the upper part (points 1, 2 and 8 in Figure 2), the sample, fixed in a movable grip, was stretched at a low constant strain rate (Fig. 3). Points 3 and 7 were located on the central transverse axis of the sample (Fig. 2).
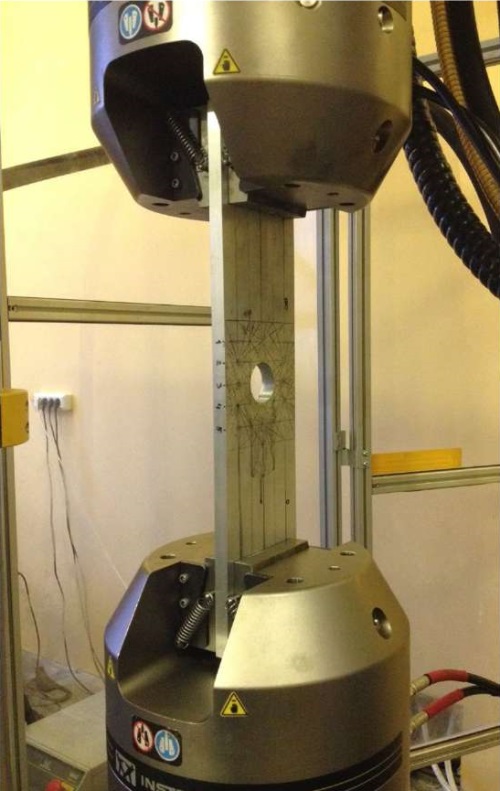
Fig. 3. Sample under load in a testing machine
The asymmetry of the problem conditions was taken into account in numerical modeling using the finite element method. The actual dimensions of the sample, its elastic and mechanical properties obtained during testing of samples from the same batch (Young's modulus E, yield strength σy, elasticity modulus H), as well as known data for commercially pure aluminum (density ρ, Poisson's ratio ν) were used. It was taken into account that the sample was fixed in the testing machine over a wide surface, and the tangential tensile load was applied to it, and not to the end of the sample, as in the case of two-dimensional models.
The stress-strain state was calculated in the ANSYS finite element modeling package. Taking into account the area of application of loads F1, F2, F3, the values of tensile stresses were determined: σ1 = 16.67 MPa, σ2 = 27.78 MPa, and σ3 = 38.89 MPa. They were used in the numerical solution. Figure 4 shows a model of the sample with the display of the finite element mesh and boundary conditions. It consists of 936,152 elements and 3,981,073 nodes.
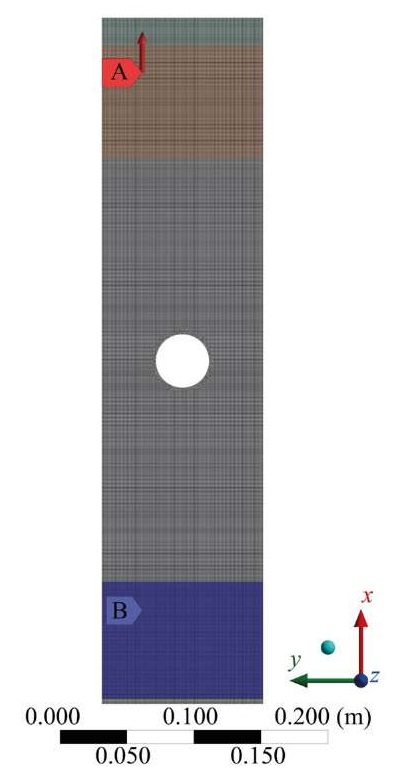
Fig. 4. Finite element model of a sample taking into account boundary conditions
The analytical solution was based on the use of formulas (4) and (5), which are the solution to the Kirsch problem in polar coordinates [18]:
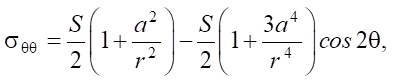 (4)
(4)
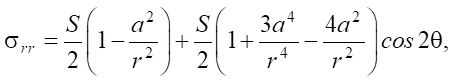 (5)
(5)
where S — load applied to the plate; a — radius of the hole in the plate; r — distance from the center of the hole to the stress calculation point; θ — angle corresponding to the point being calculated.
The formulation of the problem in this work assumes the presence of only elastic deformations of the sample. Its further development, taking into account the influence of inelastic deformations, is associated with the consideration of the solution to the plane elastic-plastic problem of stretching a plate with a circular hole (an ideal plastic body), obtained by L.A. Galin in 1946 [19].
The principal stresses co-directed with the longitudinal axis x (σθθ) and the transverse axis y of the sample (σrr) were calculated for all n = 8 points under study. The components σθθ, σrr — functions of the radial distance to the hole center r and of the angle θ, measured relative to the reference axis. Relations (4) and (5) were obtained under the assumption that the circular hole was located at the center of an infinite isotropic linear elastic plate subjected to uniform plane loading. They were previously used in [20] to determine the stresses in two regions on the boundary of the hole located along (θ = 0°) and across (θ = 90°) the line of action of the load.
Ultrasonic measurements were performed at points 1–3 (Fig. 2) in the sample before loading (F0 = 0 kN), as well as upon reaching elastic deformation levels corresponding to loads F1, F2, F3. The finite size effect of the plate (mainly, in its cross-section) on the discrepancy between the stress values obtained experimentally, numerically and analytically, was investigated. The values of acoustic anisotropy a0, % and aσ, % were calculated using formulas (2) and (3). To take into account the effects associated with stress relaxation, control measurements were performed at the start and end of each stage. A total of 198 time delays (t01, t02) and (t1, t2) were measured during the propagation of transverse waves along and across the sample.
Research Results. Table 1 shows the values of internal stresses σxx (analog σθθ in the polar coordinate system) and σyy (analog σrr) for n = 8 points around the plate hole (Fig. 2). They were obtained as a result of finite element modeling and calculations using formulas (4) and (5) with external tensile stresses σ1, σ2, σ3 (correspond to loads F1, F2, F3).
Table 1
Calculated Stress Values around the Plate Hole, MPa
|
Load |
F1 = 30 kN (σ1 = 16.67 MPa) |
F2 = 50 kN (σ2 = 27.78 MPa) |
F3 = 70 kN (σ3 = 38.89 MPa) |
|||
|
N |
σxx, σyy, |
σθθ, σrr, |
σxx, σyy, |
σθθ, σrr, |
σxx, σyy, |
σθθ, σrr, |
|
1 |
12.120 1.270 |
0.647 11.920 |
20.210 2.110 |
1.078 19.860 |
28.280 2.960 |
1.510 27.800 |
|
2, 8 |
22.090 –3.380 |
13.060 5.800 |
38.160 –5.640 |
21.760 9.666 |
53.420 –7.890 |
30.460 13.530 |
|
3, 7 |
27.690 6.390 |
25.310 6.174 |
46.157 10.650 |
42.180 10.290 |
64.610 14.910 |
59.060 14.400 |
|
4, 6 |
22.890 –3.390 |
13.060 5.800 |
38.170 –5.650 |
21.760 9.666 |
53.430 –7.920 |
30.460 13.530 |
|
5 |
12.180 1.230 |
0.647 11.920 |
20.310 2.500 |
1.0780 19.860 |
28.430 2.870 |
1.510 27.800 |
The conditions of fixing the sample are different: the left part is fixed, the right one is movable. Hence the asymmetry in the pattern of the sample deformation field, which is preserved for all values of loads in the elastic region (an example for F1 = 30 kN is shown in Figure 5).
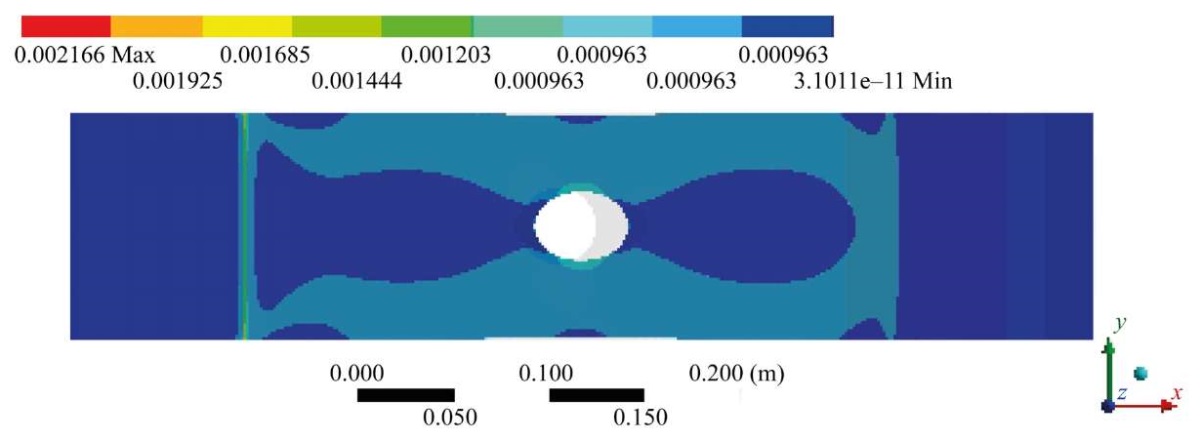
Fig. 5. Calculated deformation field under tensile load F = 30 kN
Due to the asymmetry noted above, when solving the problem using the finite element method, the stress values in pairs of points:
In the first case, pairs 2, 8; 3, 7 and 4, 6 can serve as an example, in the second case — 1, 5; 2, 4 and others. Note that even if there is a difference in stresses, it does not exceed 1 MPa. This corresponds to the engineering error level ±5% (Table 1). The stress values calculated for the specified pairs of points using formulas (4) and (5) are the same.
Finally, close values between the results of analytical and numerical calculations are observed only for points {3, 7}, located near the region with the highest stress concentration (Table 1). At the other points, there is a multiple difference not only to modulo (2, 8 and 4, 6), but also in sign (1, 5). This is due to the fact that calculations using formulas (4) and (5) for a plate of equal (infinite) dimensions assume the presence of a compressive-stress zone in the region of the location of points 1, 5. The situation is different with a real plate (Fig. 1 and 2), whose dimensions are limited and differ from each other in the ratio of length and width by 4.25 times. In this case, there is no compressive-stress zone (Table 1 and Fig. 5).
The comparison of the results suggests that the effect of the finite dimensions of the plate does not allow for the use of relations (4) and (5) to estimate the stresses in this problem. This contradicts the conclusions of [20]. Note that the presence of a correlation for points with the maximum value of the stress concentration coefficient is confirmed by the results for pair 3, 7.
Table 2 shows the initial a0 and current aσ values of acoustic anisotropy in the region of the locations of points 1, 2 and 3, calculated from formulas (2) and (3) in the no-load state (F0) and at three load values F1, F2, F3.
Table 2
Acoustic Anisotropy and Average Values of Time Delays at Different Stages of Loading
|
Load |
F0 = 0 kN σ0 = 0 MPa |
F1 = 30 kN σ1 = 16.67 MPa |
F2 = 50 kN σ2 = 27.78 MPa |
F3 = 70 kN σ3 = 38.89 MPa |
||||
|
N |
a0 |
<t01>. <t02>. μs |
aσ1 |
<t1>. <t2>. μs |
aσ2 |
<t1>. <t2>. μs |
aσ3 |
<t1>. <t2>. μs |
|
1 |
–0.005886 |
9.4805 9.4248 |
–0.006198 |
9.4765 9.4180 |
–0.006379 |
9.4802 9.4200 |
–0.006445 |
9.4783 9.4174 |
|
2 |
–0.004508 |
9.4602 9.4177 |
–0.005947 |
9.5057 9.4494 |
–0.006650 |
9.5107 9.4476 |
–0.007636 |
9.5147 9.4423 |
|
3 |
–0.005433 |
9.4730 9.4217 |
–0.006461 |
9.5113 9.4500 |
–0.007142 |
9.5161 9.4484 |
–0.007055 |
9.5158 9.4489 |
It follows from Table 2 that the difference in the values of the initial acoustic anisotropy parameter a0 at points 1, 2 and 3 is largely determined by the initial heterogeneity of the material. This is evident from the variation of parameter a0 before loading. In addition, with the application of an external load, the discrepancy between the values of the acoustic anisotropy parameter aσ at the points under study increases.
Based on the ultrasonic measurement data (Table 3), the values (σθθ – σrr) of the difference in the principal stresses in the polar coordinates were calculated using the acoustoelasticity relations (1) [21]. They are presented in Table 3 in comparison with the results of finite element modeling and calculations using formulas (4) and (5). The stress values that differ for pairs of symmetrically located points obtained by reflection relative to the transverse axis of the sample are given in parentheses.
Table 3
Comparison of Results of Ultrasonic Measurements, Analytical and Numerical Finite Element Calculations, MPa
|
Load |
F1 = 30 kN (σ1 = 16.67 MPa) |
F2 = 50 kN (σ2 = 27.78 MPa) |
F3 = 70 kN (σ3 = 38.89 MPa) |
|
N |
(σxx – σyy). Ansys (σθθ – σrr). Kirsch D(aσ1 – a0) |
(σxx – σyy). Ansys (σθθ – σrr). Kirsch D(aσ2 – a0) |
(σxx – σyy). Ansys (σθθ – σrr). Kirsch D(aσ3 – a0) |
|
1 (5) |
10.850 (10.950) –11.273 6.240 |
18.100 (17.810) –18.782 9.850 |
25.320 (25.560) –26.290 11.180 |
|
2, 8 (4, 6) |
25.470 (26.280) 7.260 28.780 |
43.800 (43.820) 12.094 42.840 |
61.310 (61.350) 16.930 62.560 |
|
3, 7 |
21.300 19.136 20.550 |
35.507 31.890 34.170 |
49.700 44.660 44.800 |
Table 3 shows that the data from acoustoelastic measurements and the finite element method solutions correlate qualitatively and quantitatively with each other. Consequently, we can talk about mutual verification of the results of full-scale and numerical experiments. The highest correlation is observed for points 2, 8; (4, 6) and 3, 7, located near the region of maximum tensile stresses.
Different results were obtained for points 1 and (5), where the presence of compressive stresses was assumed according to formulas (4), (5). Here, the differences in the principal values (σθθ – σrr), obtained according to the ultrasonic measurements, were on average two times smaller than the predicted numerical values. Thus, calculations based on the acoustic anisotropy values provide a lower estimate of the stresses for the studied sections of the sample.
Discussion and Conclusion. The principal biaxial stresses in an aluminum plate around a concentrator — a central circular hole — were investigated. The values obtained as a result of natural ultrasonic measurements, numerical experiments using the finite element method, and analytical calculations using the Kirsch relations were compared. The effect of the asymmetry of stress and strain fields, arising due to different conditions of sample fixation and reflecting the process of uniaxial elastic deformation under tension in a testing machine, was taken into account.
It was noted that similar results of the analytical and numerical calculations were observed only for points located near the region of the greatest stress concentration. In all other cases, the values differed several times both to modulo and in sign. This is explained by the presence or absence of compressive stresses. The analytical approach assumes that they exist. There are none in a real plate. Thus, the Kirsch relations for stresses of a uniaxially stretched infinite isotropic linear-elastic plate cannot be correctly applied in the case under consideration.
The acoustoelasticity method has established a correlation between the results of numerical modeling and ultrasonic measurements of biaxial stresses. This is specifically noticeable in relation to points located near the zone of maximum tensile stresses.
The research results can be used in industrial nondestructive testing for stress diagnostics in rolled metal objects.
1. GOST R 52731–2007. Nondestructive Testing. Stress Evaluation by Ultrasound. General Requirements. Electronic Fund of Legal and Technical Guidance Documents. (In Russ.) URL: https://docs.cntd.ru/document/1200051032 (accessed: 25.05.2024).
2. Devices for Measuring Mechanical Stresses IN-5101A. Operations Manual. INKO.468160.008 RE. (In Russ.) URL: https://encotes.ru/system/files/RE-IN-5101A_0.pdf?ysclid=m00rujbqr0495004447 (accessed: 25.05.2024).
1. Belyaev AK, Polyanskiy VA, Tretyakov DA. Estimating of Mechanical Stresses, Plastic Deformations and Damage by means of Acoustic Anisotropy. PNRPU Mechanics Bulletin. 2020;(4):130–151. https://doi.org/10.15593/perm.mech/2020.4.12
2. Vatul’yan AO. The Theory of Inverse Problems in the Linear Mechanics of a Deformable Solid. Journal of Applied Mathematics and Mechanics. 2010;74(6):648–653. https://doi.org/10.1016/j.jappmathmech.2011.01.004
3. Murav’ev VV, Strizhak VA, Pryakhin AV. Acousto-Elastic Study of the Internal Stresses in Metal Structures. Industrial Laboratory. Diagnostics of Materials. 2016;82(12):52–57. (In Russ.) URL: https://www.zldm.ru/jour/article/view/349/350 (accessed: 25.05.2024).
4. Kurashkin KV, Gonchar AV, Klyushnikov VA, Mishakin VV. Use of Texture-Dependent Ultrasonic Parameter as Indicator of Degradation of Hot-Rolled Thin-Sheet Steel Under Uniaxial Tension. Journal of Nondestructive Evaluation. 2022;41(2):46. https://doi.org/10.1007/s10921-022-00879-w
5. Uglov AL, Khlybov AA. On the Inspection of the Stressed State of Anisotropic Steel Pipelines Using the Acoustoelasticity Method. Russian Journal of Nondestructive Testing. 2015;51:210–216. https://doi.org/10.1134/S1061830915040087
6. Stepanova LN, Beher SA, Kurbatov AN, Tenitilov ES. Mechanical Strains Condition Investigation in Rails by means of Acoustic Elasticity and Strain Measurement. News of Higher Educational Institutions. Construction. 2013;65(7):103–109.
7. Ivanova Y, Partalin T, Pashkuleva D. Acoustic Investigations of the Steel Samples Deformation during the Tensile. Russian Journal of Nondestructive Testing. 2017;53(1):39–50. https://doi.org/10.1134/S1061830917010077
8. Volkova LV, Murav’eva OV, Murav’ev VV. Nonuniformity of Acoustic Anisotropy of Thick-Sheet Steel. Steel in Translation. 2021;51:335–341. https://doi.org/10.3103/S0967091221050120
9. Belyaev AK, Lobachev AM, Modestov VS, Pivkov AV, Polyanskii VA, Semenov AS, et al. Estimating the Plastic Strain with the Use of Acoustic Anisotropy. Mechanics of Solids. 2016;51:606–611. https://doi.org/10.3103/S0025654416050149
10. Murav’ev VV, Murav’eva OV, Volkova LV. Influence of the Mechanical Anisotropy of Thin Steel Sheets on the Parameters of Lamb Waves. Steel in Translation. 2016;46:752–756. https://doi.org/10.3103/S0967091216100077
11. Khlybov AA, Uglov AL. On an Acoustic Testing Method for Monitoring the Spatial Inhomogeneity of Plastic Deformation in Weakly Anisotropic Orthotropic Materials. Russian Journal of Nondestructive Testing. 2023;59(1):22–32. https://doi.org/10.1134/S1061830923700183
12. Nikitina NYe, Kamyshev AV, Kazachek SV. Application of the Acoustoelasticity Phenomenon in Studying Stress States in Technological Pipelines. Russian Journal of Nondestructive Testing. 2009;45:861–866. https://doi.org/10.1134/S1061830909120043
13. Никитина Н.Е. Акустоупругость. Опыт практического применения. Нижний Новгород: ТАЛАМ; 2005. 208 с. Nikitina NYe. Acoustoelasticity. Application Experience. Nizhny Novgorod: TALAM; 2005. 208 p. (In Russ.)
14. Erofeev VI, Ilyakhinsky AV, Nikitina EA, Pakhomov PA, Rodyushkin VM. Ultrasonic Sensing Method for Evaluating the Limit State of Metal Structures Associated with the Onset of Plastic Deformation. Physical Mesomechanics. 2020;23:241–245. https://doi.org/10.1134/S102995992003008X
15. Murav’eva O, Murav’ev V, Volkova L, Kazantseva N, Nichipuruk A, Stashkov A. Acoustic Properties of Low-Carbon 2% Mn-Doped Steel Manufactured by Laser Powder Bed Fusion Technology. Additive Manufacturing. 2022;51:102635. https://doi.org/10.1016/j.addma.2022.102635
16. Kurashkin KV. Study of the Acoustoelastic Effect in an Anisotropic Plastically Deformed Material. Acoustical Physics. 2019;65(3):316–321. https://doi.org/10.1134/S1063771019030047
17. Grishchenko AI, Modestov VS, Polyanskiy VA, Tretyakov DA, Shtukin LV. Experimental Investigation of the Acoustic Anisotropy Field in the Sample with a Stress Concentrator. St. Petersburg Polytechnical University Journal: Physics and Mathematics. 2017;3(1):77–82. https://doi.org/10.1016/j.spjpm.2017.02.005
18. Kirsch G. Die Theorie der Elastizitat und die Bedurfnisse der Festigkeitslehre. Zeitshrift des Vereines deutscher Ingenieure. 1898;42:797–807.
19. Galin LA. Plane Elastico-Plastic Problem. Journal of Applied Mathematics and Mechanics. 1946;10(3):367–386. (In Russ.) URL: https://pmm.ipmnet.ru/ru/get/1946/10-3/367-386 (accessed: 25.05.2024).
20. Nikitina NE, Kazachek SV. Theoretical and Experimental Study of Stress Concentration during Stretching of a Plate with a Cut. Journal of Machinery Manufacture and Reliability. 2008;37(1):38–41. URL: https://link.springer.com/article/10.1007/s12001-008-1009-9 (accessed: 25.05.2024).
21. Nikitina NYe, Kamyshev AV, Kazachek SV. The Application of the Acoustoelasticity Method for the Determination of Stresses in Anisotropic Pipe Steels. Russian Journal of Nondestructive Testing. 2015;51:171–178. https://doi.org/10.1134/S1061830915030079
Dmitry A. Tretyakov, Cand.Sci. (Eng.), Associate Professor of the Higher School of Automation and Robotics, Institute of Machinery, Materials, and Transport
29 B, Polytechnicheskaya Str., St. Petersburg, 195251
Dmitry S. Osovik, student of the Higher School of Automation and Robotics, Institute of Machinery, Materials, and Transport
29 B, Polytechnicheskaya Str., St. Petersburg, 195251
Tretyakov D.A., Osovik D.S. Estimation of Stresses in a Plate with a Concentrator through Ultrasonic Measurements of Acoustic Anisotropy. Advanced Engineering Research (Rostov-on-Don). 2024;24(4):307-315. https://doi.org/10.23947/2687-1653-2024-24-4-307-315. EDN: RMBTZU


Advanced Engineering Research (Rostov-on-Don)
ISSN 2687-1653 (Online)
Contact with: Publisher / Editorial Office of the Journal
Publisher: Don State Technical University - DSTU, Rostov-on-Don, Russia - https://donstu.ru/en/
Editor-in-Chief: Alexey N. Beskopylny, Dr.Sci. (Eng.), Professor, Vice-Rector, Don State Technical University (Rostov-on-Don, Russia)
Don State Technical University
1, Gagarin Sq., Rostov-on-Don, 344003, Russia
tel.: +7 (863) 2738-372, e-mail: vestnik@donstu.ru
16+
Processing of personal data