Contents
Scroll to:
https://doi.org/10.23947/2687-1653-2024-24-4-413-423
EDN: LNZDKF
Scroll to:
Introduction. In medicine and related industries, bioinspired approaches are used for the survival analysis, among which the Cox regression model holds a specific place. The practice of its application is described in the theoretical and applied literature. However, a significant drawback of this method requires careful study. The fact is that the features correlate with the hazard function linearly, and the model does not use more complex dependences. This causes some difficulties in studying survival analysis. The presented work is aimed at solving this problem. The object of study is the extended Cox model, in which the hazard function includes a nonlinear combination of features.
Materials and Methods. A database of prostate cancer patients was used, since this is a common diagnosis in global oncology. A class of extended Cox models with an additive/multiplicative hazard function was defined. To solve the problem using the optimization method, a fitness function was constructed that evaluated the results of prognosis, the number of features, and the degree of overtraining of the model — the complexity and load of the compiled hazard function. An algorithm of pollinating ants has been developed to optimize the fitness function. It simulates the reproduction of flowering plants using pollinating insects and consists of three parts: an ant colony algorithm, a genetic algorithm, and an ant pollinator algorithm. The quality of training of the Cox model was assessed by C-index.
Results. A metaheuristic algorithm for ant pollinator optimizing was proposed, providing for the construction of hazard functions of the extended Cox model. The set of parameters for training the standard Cox model was the entire set of features used: TNM, prostate-specific antigen doubling time (PSADT), Gleason score, serum PSA concentration at diagnosis, patient age and education, Rh factor. C-index value of the trained model was 0.853691. The extended Cox model with the found additive/multiplicative hazard function had a higher C-index value — 0.856241 with a smaller number of features used (TNM, PSADT, and Gleason score). In terms of quality, this approach is not inferior to or superior to the classical Cox model. Reducing the number of features involved should improve the efficiency of medical decisions and speed up the start of treatment.
Discussion and Conclusion. The presented algorithm for constructing survival analysis models increased the accuracy of predicting the occurrence of a terminal event, and reduced the number of features used for this purpose. The difference in accuracy for the studied data set seemed insignificant — C-index increased from 0.853691 to 0.856241 (by 0.3%). At this, the number of features taken into account was reduced from 7 to 3 (by 57.1%). Consequently, the proposed method effectively solves the problem of feature selection, and can be applied to improve the quality of prognostication.
Mikulik I.I., Zharinov G.M., Kneev A.Yu. Algorithm for Constructing the Hazard Function of the Extended Cox Model and its Application to the Prostate Cancer Patient Database. Advanced Engineering Research (Rostov-on-Don). 2024;24(4):413-423. https://doi.org/10.23947/2687-1653-2024-24-4-413-423. EDN: LNZDKF
Introduction. Survival analysis is a set of statistical methods that provide the estimation of the probability of a terminal event, after which the object goes out of control. The methods involve working with data that has a time characteristic. This is the time from the beginning of observation to the occurrence of a terminal event or the exit of an object from observation. The possibility of working with objects that have been no longer under observation is of interest to applied areas of science, including medicine [1].
One of the classic models of survival analysis is Cox regression model [2]. Its hazard function uses a linear combination of features, which in general may not be entirely correct, since the influence of features on the hazard function value can be expressed by a nonlinear correlation. For each problem, the contribution of features and the hazard function can correlate differently. This is determined by the data used and requires special approaches to finding forms of dependences. Various methods for determining dependences of features in the hazard function are considered in [3]. This paper proposes to use the extended Cox model, whose hazard function establishes not only an additive, but also a multiplicative combination of features. Aside from that, a method for constructing such models is described depending on the data used and the set of features.
Building a model involves solving the problem of feature selection, one of the key problems in data analysis [4]. It consists of finding the optimal set of features sufficient to build a forecast. The solution gives an idea of which features have greater prognostic significance. The problem can be formulated in terms of optimization and solved using optimization methods. The proposed ant pollinator algorithm for its solution refers to metaheuristic hybrid optimization methods. It uses ant colony and genetic optimization algorithms, as well as the first developed model of flower crossing.
The algorithm is implemented on the basis of data of patients with prostate cancer. In the world medical practice, this is one of the most common malignant neoplasms in men [5]. The introduction of screening based on the assessment of serum concentration of prostate-specific antigen (PSA) has significantly changed the structure of newly diagnosed cases of prostate cancer. If previously most of them were locally advanced and metastatic forms of tumor, now localized forms dominate. Due to this, the frequency of radical interventions has increased, and the ten-year survival rates of certain groups of patients who have undergone radical prostatectomy or combined hormonal radiation therapy have approached 100%.
Despite the obvious success in the diagnosis and treatment of prostate cancer, several important issues remain unresolved and require research.
Modern methods for predicting survival in prostate cancer are based on a combination of factors: age, tumor grade and histological differentiation, serum PSA concentration, its doubling time [6] and density [7]. The Cox and other models of survival analysis provide a general idea of fate, but their accuracy in predicting outcomes for individual patients can vary. Moreover, a prognosis based on a set of features does not provide an indication of the significancy of each feature. This limits the ability of clinicians to adapt treatment recommendations to the needs of an individual patient.
Improving approaches to assessing cancer patient survival is a key aspect of scientific research in oncology. More and more attention is being paid to the accuracy of prediction, which is critical for selecting a therapeutic strategy. A high-quality prognostic model more accurately determines the risk for the patient and allows for adapting treatment approaches depending on the expected outcome. This can improve both treatment outcomes and the patient’s quality of life.
Under conditions of high workload for medical personnel, limiting the number of features in the forecast model is of significant practical value, as it shortens the time spent on making medical decisions. Simplifying the model allows focusing on key aspects of the clinical picture, which reduces the likelihood of incorrect interpretations of data. In addition, the use of a limited set of features increases the reproducibility and stability of the forecast results, i.e., its reliability.
The objective of this research is to develop an algorithm for constructing survival analysis models with the selection of key features. The accuracy of the new approach should be no lower than that of the Cox model. Note that various methods for constructing hazard functions of the Cox model define not one extended Cox model, but a whole class of algorithms with different hazard functions. This approach to adapting the hazard function to the set of available data and features is selected as a way to achieve the stated goal.
The tasks solved in this research are listed below.
Materials and Methods. In the survival analysis, survival and hazard functions are used to estimate the risk of the event under consideration. The first function is a stochastic characteristic that determines the probability of survival (absence of a terminal event) over a given time. In other words, survival function S(t) is defined as the probability that the terminal event does not occur before time t:
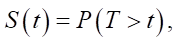
where T — time of the terminal event occurrence.
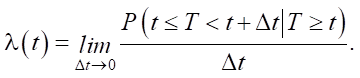
Survival analysis models construct survival curves for each data sample based on its features. The models are often specified using a hazard function, which defines the probability of a terminal event occurring in an infinitesimal time interval between t and Δt, given that it has not occurred before t:
The Cox proportional hazards model computes the hazard function for a single instance as a linear combination of its features, establishing a relationship between the instance features and the hazard function.
On the one hand, the explicit assignment of the hazard function makes the model transparent and convenient for interpreting forecasts. On the other hand, the assumption of a linear relationship between features and forecast is a limitation and cannot be fulfilled for all practical problems.
Research Results. Let S be the training dataset. The hazard function in the classical Cox model is:

where β — vector of influence of features; Xi ∊ S — data instance.
In [3], the hazard function of the Cox model is considered in a generalized form λ(t|Xi) = λ0exp(g(β⋅Xi)), where g(β⋅Xi) is the function that establishes the relationship between the features of the instances. In this paper, function g is a polynomial of a special form.
Let F = {f1, f2, …, fn} be a set of all features. |F| = p. Ft — a subset of features: Ft ⊂ F. Pq(Ft) — polynomial composed of features f ∊ Ft:
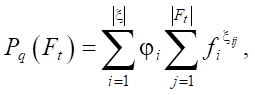
where 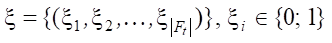 — a set of indicators of the occurrence of the i-th feature in the term of the polynomial; φi ∊ {0, 1} — marker indicating the occurrence of the i-th monomial in Pq.
Thus, polynomial Pq(Ft) is the sum of monomials, each of which is a product of features. In this case, the degree of a feature in a monomial is no more than one. Hazard function λ(t|Xi) = λ0exp(g(β⋅Xi)), where g(β⋅Xi) = Pq(Ft, β⋅Xi), is called additive-multiplicative, since the value of each feature in it can be included either in the sum or in the product.
To obtain and process the results, it is required to evaluate the quality of the constructed model. In [8], the quality of the model is evaluated using the loss function, and this is a general approach for any learning model. The most commonly used evaluation indicator is the Concordance index (C-index). It was also selected to evaluate the extended Cox model. The C-index takes into account both observed events and censored cases [9]. Here, the rank correlation between the actual survival time and the model predictions is quantitatively determined. The C-index shows the ratio of correctly ordered (concordant) and comparable pairs [10].
The paper considers the hypothesis of an extended Cox model with prediction accuracy no lower than that of the classical Cox model.
Let c(S, Pq(Ft)) be the C-index of the extended Cox model trained on data , with an additive-multiplicative hazard function constructed using polynomial Pq(Ft), and c(S, P∑(F)) — C-index of the classical Cox model trained on the same data . The hypothesis can be formulated as:
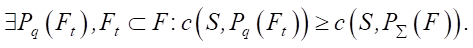 (1)
(1)
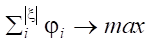
To find non-trivial examples of the hypothesis, a problem was set and an algorithm was developed. The problem can be formulated in terms of the optimization theory. It is necessary to construct polynomial Pq(Ft) on subset F with the largest value c(S, Pq(Ft)) with a minimum set of features Ft. Т Thus, two optimization conditions are introduced c(S, Pq(Ft)) → max and |Ft| → min. Another problem of constructing a polynomial should be taken into account. As the number of possible features increases, the number of possible polynomials, including those constructed due to overfitting, grows exponentially. Typically, such polynomials consist of the sum of a relatively large number of monomials, and the monomials themselves consist of a large number of factors. Such polynomials increase the accuracy of the model only on trained data and do not readily lend themselves to analysis.
To get rid of the problem of overtraining, the paper proposes optimization by two additional criteria: the number of monomials in Pq(Ft) and the loading of polynomial Pq(Ft), which reflects the number of multiplicative connections in the polynomial.
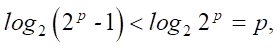
The number of monomials is defined as  . However, to construct a correct condition, it is necessary to take into account the nonlinearity of the contribution of the number of features to the objective function. With a small number of incoming features, a more significant change in the indicator is expected than with a large one. Therefore, the paper proposes the indicator:
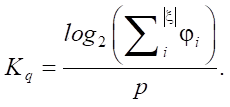
Note that value Kq does not exceed 1.
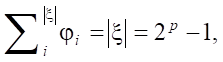
 at Ɐφi = 1, hence:

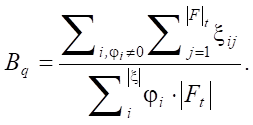
It is not entirely correct to define the polynomial loading as the number of multiplicative bonds. In this case, the real assessment of the polynomial complexity is not reflected with a different number of monomials included in it. The indicator should demonstrate the loading of each incoming monomial; therefore, the following value is introduced in the work, not exceeding 1:
Given the introduced characteristics, the optimization problem consists of finding  under the conditions:
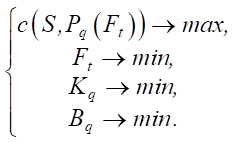 (2)
(2)
Let us move on to one-dimensional optimization by introducing balancing coefficients  :
:
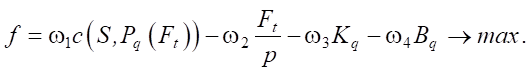
Or it is represented as a sum:
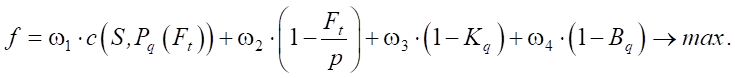 (3)
(3)
The last form of recording, if necessary, allows us to fix the value of the objective function  by introducing an explicit relationship between the balancing coefficients:
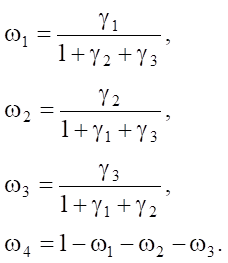
For any γ1, γ2, γ3 ∊ (0; 1). Thus, by selecting the required γi or directly ωi, it is possible to strengthen or weaken the corresponding conditions of system (2). The task is to find the maximum of the objective function (3) under certain ωi.
To solve the optimization problem, the article presents the developed ant pollinator algorithm. It is based on the model of an ant colony adapted to the task. The algorithm transforms a set of graph vertices representing features or their product into a model. The process of pollination and reproduction of flowering plants using pollinating insects is simulated. The solution includes three algorithms:
The result of the algorithm is polynomial Pq(Ft), which maximizes function f (3). Each monomial included in the sum of the polynomial is represented by a flower. The set of flowers forms a graph. The pollinating ants build a path along it. Each ant determines a set of flowers, and the sum of the corresponding monomials forms polynomial Pq(Ft). The estimate of the path built by the ant is the value of function f (3) for the extended Cox model with g = Pq(Ft).
The ant stage of the algorithm is a simple ant colony algorithm adapted to the problem [11]. Each ant k has a different set of parameters αk, βk, Qk. The sensitivity of ants to pheromones
 determines the degree to which ants exploit the solutions found. The heuristic sensitivity βk sets the level of exploitation of heuristic information. The pheromone intensity Qk determines the amount of pheromone that an ant deposits on a flower during the search for a solution. The static parameters of the algorithm are: number of ants n, evaporation rate ρ, initial level of pheromones τ0.
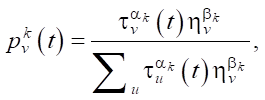
Each ant chooses a vertex stochastically according to the rule:
 (4)
(4)
where  — probability of choosing flower v by ant k at iteration t; τv(t) — amount of pheromone deposited on flower v at iteration t; ηv — heuristic information, which is calculated as ηv = c(S, Pi ≡ v). The second part of this equality is the C-index of the extended Cox model trained on one monomial of flower v.
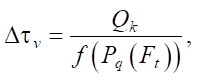
Each ant deposits pheromone according to the rule:
 (5)
(5)
where Pq(Ft) — polynomial constructed by ant k; f — objective function.
The second stage is the application of the genetic algorithm. It modifies parameters of the ant colony algorithm taking into account the efficiency of the solutions found [12]. The algorithm sequentially applies three operators to the ant population (their parameters): selection, crossing over, mutation. The roulette wheel method is used as the selection operator. An ant gets into a new population with the probability:
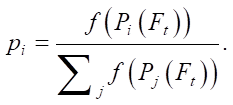 (5)
(5)
The crossover operator is the bitwise sum of the bit representations of the parameters of the selected individuals. The mutation operator is the inversion of a random bit in the bit representation of the parameter of the individual.
Pheromones left on vertices-flowers are also used at the pollination stage. This stage employs the population idea. Four operators are applied to the flower population: selection, crossbreeding, linebreeding, and aging. Each flower, in addition to the stored value of the vertex-monomial, has a parameter — age. The selection operator choses flowers with the highest concentration of pheromones. The crossbreeding operator introduces new flowers with some probability, the monomial of which is the product of the combination of features from the monomials of the parent flowers:
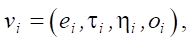

where e — monomial of a new flower; τ — random amount of pheromone not exceeding τ0, deposited on the flower; η — heuristic component; o — age of the flower; omax — established lifetime of the flower.
If the transformation results in flowers already in the population, then new flowers are not created, but the age of the existing ones is updated. The linebreeding operator is unlikely to add a new flower with a single feature to the population. This operator is used to leave the opportunity for displaced traits to participate in the algorithm. The aging operator decreases the age indicator for each flower. If the aging indicator becomes zero, the flower is eliminated from the population.
Thus, the configurable parameters of the algorithm are: n, τ0, ρ, omax, α0, β0, Q0, pkross, pmut. The selection of their values depends on the current application task and affects the convergence rate of the algorithm. Note that the parameters α0, β0, Q0 are adapted under the operation of the genetic algorithm; therefore, their initial values do not have a large effect on the convergence rate of the algorithm, especially with a significant number of iterations of the algorithm presented below.
Start
1. Define parameters n, τ0, ρ, omax, α0, β0, Q0, pkross, pmut
2. Set c = 0, P = ∅
3. Place a set of flowers V = {vi = (ei = fi, τi = rand(0, τ0), ηi = c(S, Pi ≡ fi), oi = omax) | Ɐfi ∈ F}
4. Place a set of ants A = {αk = (αk = α0, βk = β0, Qk = Q0)}
5. Until the stop criterion is reached
5.1. For every ant αk ∈ A
5.1.1 Ek(t) = {vrandom}
5.1.2. ck(t – 1)
5.1.3. ck(t) = ηi
5.1.4. Until ck(t) > ck(t – 1)
5.1.4.1. Select v in accordance with rule (4)
5.1.4.2. Ek(t) = ∪ {v}
5.1.4.3. ck(t – 1) = ck(t)
5.1.4.4. 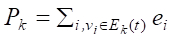
5.1.4.5. ck(t) = f(S, Pk)
5.1.5. If ck(t) > c
5.1.5.1. c = ck(t)
5.1.5.2. P = Pk
5.1.6. For each vi ∈ Ek(t), calculate Δτv according to rule (5)
5.2. Apply the selection operator A = Sselection(A)
5.3. Apply the crossover operator A = Scrossover(A)
5.4. Apply the mutation operator A = Smutation(A)
5.5. Apply the flower selection operator V = Sselection(V)
5.6. Apply the crossbreeding operator V = Scrossbreeding(V)
5.7. Apply the linebreeding operator V = Slinebreeding(V)
5.8. Apply the aging operator V = Saging(V)
6. Return values c, P
The algorithm's stop criterion can be the number of iterations or the convergence of solutions to a single value. Thus, the presented method of optimizing pollinating ants solves the problem of constructing a hazard function and selecting features for the extended Cox model. If there are non-trivial examples for hypothesis (1), they can be found by the described method.
The algorithm was tested on a database of patients with prostate cancer. They were treated or observed from January 1996 to December 2016 at the Russian Scientific Center of Radiology and Surgical Technologies named after Academician A.M. Granov, Ministry of Health of the Russian Federation [13]. The study included anonymized data on the prevalence of the tumor process in 5,073 patients.
The list of features used in the research, with the description and the number of non-zero entries, is presented in Table 1.
Table 1
Dataset Features
|
Name of the feature |
Description |
Value |
Number of completed records |
|
|
short |
full |
|||
|
‘TS’ |
Type of tumor spread |
Damage to adjacent organs and structures, presence of regional and distant metastases |
1 — localized 2 — locally advanced 3 — metastatic |
5073 |
|
‘DT’ |
PSA doubling time |
Doubling of serum PSA concentration indicating possible doubling of tumor cell count |
Floating point number |
2423 |
|
‘GS’ |
Gleason score |
Ordinal variable. Reflects the histological differentiation of the tumor |
1 — GS < 7 2 — GS = 7 3 — GS > 7 |
3968 |
|
‘PSA’ |
Serum PSA concentration that prompted biopsy |
Prostate-specific antigen. Glycoprotein, serine protease normally produced by the secretory epithelium of the prostate gland. Liquefies ejaculate, improves sperm motility. Concentration above 4 ng/ml may be grounds for biopsy. |
Floating point number |
4760 |
|
‘Education’ |
Patient's education level |
Completed patient’s education at time of diagnosis |
0 — secondary general 1 — secondary special 2 — higher 3 — academic degree |
4622 |
|
‘Age’ |
Age of the patient |
Patient's age at diagnosis |
Integer |
5073 |
|
‘Rhesus’ |
Rhesus factor |
The presence or absence of the protein responsible for the Rh factor |
1 — positive 2 — negative |
399 |
Not all the features presented in Table 1 are essential for the survival study. There are also insignificant ones (e.g., ‘Education’, ‘Rhesus’). They are needed to demonstrate the correct operation of the algorithm that solves the problem of feature selection. The presence of correlated and not very important features shows the practical possibility of using the algorithm under conditions when neither the dependence of features nor their significance are known in advance.
The algorithm is implemented in the Python programming language in the CoxPHFitter package from the Lifelines library. The Pandas software library was used to store and process the data.
Before running the algorithm, the data was preprocessed. This is due to the fact that the prostate cancer patient database has gaps in a number of values for some patients. To eliminate the problem, two methods of processing the database were used — deleting observations and replacing them taking into account other values in the column [14]. The features ‘TS’, ‘DT’ and ‘age’ are important and play a role in the consistency of the data; therefore, observations without these features were removed. The Gleason score was ranked. Each observation was assigned one of three values: 1 — GS < 7 (1281 observations), 2 — GS = 7 (1479 observations), 3 — GS > 7 (1208 observations).
For the remaining features, missing values are filled using the weighted k- nearest neighbors method. This missing value imputation is based on the assumption that the proximity of samples by measured features indicates their proximity by unmeasured features [15]. The weighted k-nearest neighbors method is preferable due to the low time costs of missing value imputation [16], although there are more efficient approaches [17].
The algorithm is implemented with the following set of parameters: n = 12; τ0 = 0,01; ρ = 0.8; omax = 3; α0 = 0.5; β0 = 2; Q0 = 25; pkross = 0.9; pmut = 0.2. The given list of parameter values is recommended for the initial configuration of the algorithm. However, it can be modified to solve a specific problem. Table 2 presents the results of the proposed algorithm.
Table 2
Values of C-index and Fitness Function  Depending on Polynomial of Hazard Function of Extended Cox Model, Found for Given Balancing Coefficients
|
Polynomial of additive-multiplicative hazard function of extended Cox model |
C-index |
Fitness function |
Balancing coefficients |
|
‘TS’ + ‘DT’ |
0.836789 |
0.782894 |
0.91;0.05;0.05;0.05 |
|
‘TS’ × ‘GS’ + ‘DT’ |
0.840516 |
0.842814 |
0.99;0.05;0.05;0.05 |
|
‘TS’ + ’DT’ + ‘GS’ |
0.849790 |
0.746328 |
0.9;0.0;0.05;0.05 |
|
‘TS’ + ‘DT’ + ‘GS’ + ‘TS’ × ‘DT’ |
0.849828 |
0.827410 |
0.94;0.05;0.0;0.0 |
|
‘TS’ + ‘GS’ + ‘TS’ × ‘DT’ × ‘GS’ |
0.849830 |
0.841567 |
0.97;0.05;0.05;0.0 |
|
‘TS’ + ‘GS’ + ‘DT’ × ‘GS’ |
0.850000 |
0.787661 |
0.94; 0.0;0.05;0.0 |
|
‘TS’ + ‘DT’ + ‘GS’ + ‘PSA’ + ‘Education’ + ‘Age’ + ‘Rh’ |
0.853691 |
0.838012 |
0.99; 0.0;0.0;0.05 |
|
‘TS’ + ‘DT’ + ‘GS’ + ‘TS’ × ‘GS’ |
0.855292 |
0.809308 |
0.94;0.05;0.0;0.05 |
|
‘TS’ + ‘TS’ × ‘GS’ + ‘GS’ + ‘ТР’ × ‘DT’ |
0.856241 |
0.764870 |
0.91;0.0;0.05;0.0 |
|
‘TS’ + ‘TS’ × ‘GS’ × ‘PSA’ + ‘ПГ’ + ‘PSA’ + ‘GS’ × |
0.861085 |
0.839459 |
0.95;0.05;0.0;0.0 |
|
‘TS’ + ‘DT’ + ‘GS’ + ‘PSA’ + ‘Education’ + ‘Age’ + |
0.861643 |
0.826508 |
0.97;0.0;0.0;0.05 |
|
‘TS’ + ‘DT’ + ‘GS’ + ‘PSA’ + ‘Education’ + ‘Rh’ + |
0.862345 |
0.845098 |
0.98;0.0;0.0;0.0 |
In Table 2, the variations of the occurrence of features in the hazard function are ranked in ascending order of the C-index. The values of the balancing coefficients of fitness function (3), for which the presented solution was found, and the value of the function itself are also indicated here. The last rows of the table contain the hazard functions with the highest concordance index. They are quite complex for analysis due to the loading associated with the low values of the corresponding balancing coefficients.
Discussion and Conclusion. The best set of features for training the standard (non-extended) Cox model is the entire set of features presented, i.e., function ‘TS’ + ‘DT’ + ‘GS’ + ‘PSA’ + ‘Education’ + ‘Age’ + ‘Rh’ with the C-index value of 0.853691. At the same time, the extended Cox model with the found hazard function ‘TS’ + ‘TS’ × ‘GS’ + ‘GS’ + ‘TS’ × ‘DT’ has the higher C-index value of 0.856241 with a smaller number of features used.
The results of this research allow us to draw certain conclusions. If we keep in mind the presented database, then the parameters ‘TS’, ‘DT’, ‘GS’ are sufficient to build a high-quality survival analysis model. Thus, the result of the study is the possibility of building a survival model with a smaller number of features used. Moreover, the proposed solution is not inferior to or exceeds the effectiveness of the classical Cox model, for the training of which numerous features are used.
The algorithm created within the framework of this work is capable of solving the problem of finding the best combination of features in an acceptable number of iterations (30). A set of regularizing coefficients provides setting a certain configuration for the algorithm. Thus, an application engineer can make a choice in favor of improving the quality of prediction, reducing the number of features or eliminating the problem of overfitting.
Thus, the class of metaheuristic algorithms is acceptable for solving the problem. At the pollination stage, monomials are constructed in a polynomial, i.e., the search for multiplicative dependences of features is performed. At the stage of the ant colony algorithm, a polynomial is constructed from monomials, i.e., the search for additive dependences of features is carried out. The genetic stage is required to improve the convergence and stability of the ant colony algorithm.
For the data set considered, the proposed algorithm increased the prediction accuracy. Yet, only slightly. C-index increased by only 0.3%, from 0.853691 to 0.856241. However, the number of features considered decreased by 57.1%, from 7 to 3. Fewer features in the predictive model make the work of doctors easier, allow them to gain time when making decisions, and can reduce the likelihood of errors in interpreting data.
1. Archetti A, Lomurno E, Lattari F, Martin A, Matteucci M. Heterogeneous Datasets for Federated Survival Analysis Simulation. In: Proc. Companion of the 2023 ACM/SPEC International Conference on Performance Engineering. New York: Association for Computing Machinery; 2023. P. 173–180. http://doi.org/10.1145/3578245.3584935
2. Atlam M, Torkey H, El-Fishawy N, Salem H. Coronavirus Disease 2019 (COVID-19): Survival Analysis Using Deep Learning and Cox Regression Model. Pattern Analysis and Applications. 2021;24:993–1005. http://doi.org/10.1007/s10044-021-00958-0
3. Govindarajulu US, Malloy EJ, Ganguli B, Spiegelman D, Eisen EA. The Comparison of Alternative Smoothing Methods for Fitting Non-Linear Exposure-Response Relationships with Cox Models in a Simulation Study. The International Journal of Biostatistics. 2009;5(1):2. http://doi.org/10.2202/1557-4679.1104
4. Miren Hayet-Otero, Fernando García-García, Dae-Jin Lee, Joaquín Martínez-Minaya, Pedro Pablo España Yandiola, Isabel Urrutia Landa, et al. Extracting Relevant Predictive Variables for COVID-19 Severity Prognosis: An Exhaustive Comparison of Feature Selection Techniques. PLoS One. 2023;18(4):e0284150. https://doi.org/10.1371/journal.pone.0284150
5. Berenguer CV, Pereira F, Câmara JS, Pereira JA. Underlying Features of Prostate Cancer — Statistics, Risk Factors, and Emerging Methods for Its Diagnosis. Current Oncology. 2023;30(2):2300–2321. https://doi.org/10.3390/curroncol30020178
6. Zharinov GM, Bogomolov OA. The Pretreatment Prostate-Specific Antigen Doubling Time: Clinical and Prognostic Values in Patients with Prostate Cancer. Cancer Urology. 2014;(1):44–48.
7. Kneev AY, Shkol’nik MI, Bogomolov OA, Zharinov GM. Prostate Specific Antigen Density as a Prognostic Factor in Patients with Prostate Cancer Treated with Combined Hormonal Radiation Therapy. Siberian Journal of Oncology. 2022;21(3):12–23. https://doi.org/10.21294/1814-4861-2022-21-3-12-23
8. Ewees AA, Al-qaness MA Abualigah L, Oliva D, Algamal ZY, Anter AM, et al. Boosting Arithmetic Optimization Algorithm with Genetic Algorithm Operators for Feature Selection: Case Study on Cox Proportional Hazards Model. Mathematics. 2021;9(18):2321. https://doi.org/10.3390/math9182321
9. Alabdallah A, Ohlsson M, Pashami S, Rögnvaldsson Th. The Concordance Index Decomposition: A Measure for a Deeper Understanding of Survival Prediction Models. Artificial Intelligence in Medicine. 2024;148:102781. https://doi.org/10.48550/ARXIV.2203.00144
10. Cavalcante Th, Ospina R, Leiva V, Cabezas X, Martin-Barreiro C. Weibull Regression and Machine Learning Survival Models: Methodology, Comparison, and Application to Biomedical Data Related to Cardiac Surgery. Biology. 2023;12(3):442. https://doi.org/10.3390/biology12030442
11. Guangyu Liu, Yuwei Bai, Ling Zhu, Qingyun Wang, Wei Zhang. A Sequential Excitation and Simplified Ant Colony Optimization Based Global Extreme Seeking Control Method for Performance Improvement. Swarm and Evolutionary Computation. 2024;86:101522. https://doi.org/10.1016/j.swevo.2024.101522
12. Blagoveshchenskaya EA, Mikulik II, Strüngmann LH. Ant Colony Optimization with Parameter Update Using a Genetic Algorithm for Travelling Salesman Problem. In: Proc. Workshop “Models and Methods for Researching Information Systems in Transport”. 2020;2803:20–25. URL: https://ceur-ws.org/Vol-2803/paper3.pdf (accessed: 17.09.24).
13. Zharinov GM. Prostate Cancer Patients Database. RF Database, no. 2016620331. 2016. 1 p. (in Russ.) URL: https://www1.fips.ru/fips_servl/fips_servlet?DB=DB&DocNumber=2016620331&TypeFile=html (accessed: 17.09.2024).
14. Ghannad-Rezaie M, Soltanian-Zadeh H, Hao Ying, Ming Dong. Selection-Fusion Approach for Classification of Datasets with Missing Values. Pattern Recognition. 2010;43(6):2340–2350. https://doi.org/10.1016/j.patcog.2009.12.003
15. Troyanskaya O, Cantor M, Sherlock G, Brown P, Hastie T, Tibshirani R, et al. Missing Value Estimation Methods for DNA Microarrays. Bioinformatics. 2001;17(6):520–525. https://doi.org/10.1093/bioinformatics/17.6.520
16. Koshechkin AA, Andryushchenko VS, Zamyatin AV. A New Method to Missing Value Imputation for Immunosignature Data. CTM (Sovremennye tehnologii v medicine). 2019;11(2):19–24. https://doi.org/10.17691/stm2019.11.2.03
17. Eunseo Oh, Hyunsoo Lee. Quantum Mechanics-Based Missing Value Estimation Framework for Industrial Data. Expert Systems with Applications. 2024;236:121385. https://doi.org/10.1016/j.eswa.2023.121385
Ilya I. Mikulik, Postgraduate student of the Higher Mathematics Department
9, Moskovsky Pr., St. Petersburg, 190031
Gennadiy M. Zharinov, Dr.Sci.(Medicine), Professor, Chief Researcher of the Department of Radiation and Combined Methods of Treatment
70, Leningradskaya Str., v. Pesochny, St. Petersburg, 197758
Aleksei Yu. Kneev, Cand.Sci.(Medicine), Senior Lecturer ofthe Department of Radiology, Surgery and Oncology, Oncologist of the Department of Oncourology
70, Leningradskaya Str., v. Pesochny, St. Petersburg, 197758
Mikulik I.I., Zharinov G.M., Kneev A.Yu. Algorithm for Constructing the Hazard Function of the Extended Cox Model and its Application to the Prostate Cancer Patient Database. Advanced Engineering Research (Rostov-on-Don). 2024;24(4):413-423. https://doi.org/10.23947/2687-1653-2024-24-4-413-423. EDN: LNZDKF


Advanced Engineering Research (Rostov-on-Don)
ISSN 2687-1653 (Online)
Contact with: Publisher / Editorial Office of the Journal
Publisher: Don State Technical University - DSTU, Rostov-on-Don, Russia - https://donstu.ru/en/
Editor-in-Chief: Alexey N. Beskopylny, Dr.Sci. (Eng.), Professor, Vice-Rector, Don State Technical University (Rostov-on-Don, Russia)
Don State Technical University
1, Gagarin Sq., Rostov-on-Don, 344003, Russia
tel.: +7 (863) 2738-372, e-mail: vestnik@donstu.ru
16+
Processing of personal data