Contents
Scroll to:
https://doi.org/10.23947/2687-1653-2025-25-3-242-255
EDN: CRISFJ
Scroll to:
Introduction. The creation of reliable test sets of vibration signals remains a critical challenge in vibrodiagnostics, as the lack of data on early-stage bearing defects hinders the development and validation of diagnostic algorithms. Experimental acquisition of such signals is limited by the absence of appropriate test specimens and the long duration required for defect progression. Existing numerical simulation approaches demand high computational resources and complex setup, reducing their practical applicability. A significant gap in current research is the absence of a simple, reproducible, and validated methodology for generating signals that reflect the progressive development of defects. The objective of this study is to create a simplified methodology for generating a test set of bearing vibration signals that can be used to develop and verify new vibrodiagnostic techniques. The methodology is based on a combination of experimental and simulated signals.
Materials and Methods. Experimental data were obtained from a laboratory setup simulating a rotor unit with a rolling bearing (type 180603). To simulate early-stage defects (single and double chipping pits), dynamic finite element modelling was performed using ANSYS Mechanical (version 16.2) based on plane elements Plane162 using the LS-DYNA package. The resulting impulse sequences were superimposed onto the measured signal from a healthy bearing to generate combined signals. All signals (3 experimental, 2 combined) were analyzed using Fourier transform, bandpass filtering (5.4 kHz), and calculation of statistical parameters: root mean square (RMS), crest factor, and excess coefficient. Analysis was conducted in Mathcad (version 15.0).
Results. As a result of the study, a method for generating a test set of vibration signals from a rolling bearing was developed, covering the serviceable state and the sequential development of a local defect of the outer ring. The results showed a correlation between the amplitude of vibration signals and the stages of defects — an increase in amplitudes was observed in the high-frequency region, which confirmed the interaction of rolling elements and defective surfaces. Additional statistical analysis revealed an increase in diagnostic parameters (RMS value, crest factor, and excess coefficient) as the damage developed. It was found that the simulated signals reproduced the characteristic signs of a defect and fitted correctly into the general trend of parameter changes.
Discussion. The data obtained demonstrate that the proposed technique makes it possible to simplify the generation of reference signals without the need for long-term accumulation of experimental data or damage to equipment. The physical validity of the simulated pulses and the consistency of growth dynamics of diagnostic parameters with real data confirm the possibility of using this method for standardized testing of vibrodiagnostic techniques.
Conclusion. The developed methodology provides an efficient and reproducible approach to generating test signal sets for vibrodiagnostics. It can be used to accelerate algorithm verification, reduce experimental costs, and improve diagnostic reliability. Future research will focus on simplifying impulse generation through analytical modelling and extending the methodology to other bearing types and defect forms.
Kolosova Z.A., Kolosova O.P., Shnayder D.A. Obtaining a Set of Vibrational Signals from Rolling Bearings with Varying Degrees of Local Defect Development in the Outer Ring. Advanced Engineering Research (Rostov-on-Don). 2025;25(3):242-255. https://doi.org/10.23947/2687-1653-2025-25-3-242-255. EDN: CRISFJ
Introduction. In modern industry, there is a tendency for the size, complexity and productivity of machinery to increase, which results in growing capital expenditure on its acquisition, repair and maintenance. Equipment shutdowns cause significant losses due to short-received production.
A considerable part of rotating industrial equipment contains rolling bearings. In most cases, their technical condition is the decisive factor in ensuring trouble-free operation — i.e., the failure of a rolling bearing causes the failure of the entire product. Experts in vibrodiagnostics are faced with the need to analyze and interpret vibration signals to assess the condition of rolling bearings. The presence of a set of signals reflecting various stages of fault growth is critical for the development and testing of new diagnostic techniques. This allows not only for improvement of accuracy and reliability of diagnostic algorithms, but also for their adaptation to real operating conditions of the equipment. However, obtaining such a set of signals under real conditions is a difficult task [1]. Traditional methods include either waiting for the natural occurrence of a fault, which can take a significant amount of time, or intentional damage to the bearing, which is not always advisable and can cause additional costs. In this regard, there is a need to develop alternative approaches to obtaining vibration signals with varying degrees of fault development.
One such technique is mathematical modeling and simulation of bearing vibration signals [2]. Researchers have developed various models, including systems with three [3] and two degrees of freedom [4]. These models take into account factors, such as radial clearance, number of balls, and localized faults on the inner race, outer race, or balls. Advanced stochastic models have been proposed that take into account random sliding of roller elements and periodically changing transfer functions [5]. Simulations by MATLAB have been used to generate vibration time signals and frequency spectra [4].
However, modeling bearing vibration signals remains a non-trivial task related to a number of technical and methodological difficulties. First, real bearing systems have a high degree of complexity [6]. An accurate representation of all factors affecting bearing vibrations in a single model is practically impossible. Models often simplify complex interactions between components, which can result in potential inaccuracies in predictions. Second, bearings exhibit nonlinear dynamic behavior, specifically in the presence of faults [7]. This nonlinearity is difficult to capture in mathematical models, especially when dealing with composite faults, such as simultaneous faults on the inner and outer races. Third, there is a problem of parameter uncertainty [8]. Numerous models depend on parameters that are difficult to measure or accurately estimate, such as contact stiffness and damping coefficients. This further complicates the modeling process and can cause inaccuracies in the results [9]. More complex models require significant computational resources, making real-time analysis challenging for industrial applications. Some models may ignore important factors, such as temperature effects, lubrication conditions, or manufacturing variations, leading to discrepancies between predicted and actual behavior [9]. Due to the lack of calibration bearings, experimental validation capabilities are limited, challenging the completeness and reliability of verification of the developed mathematical models [10].
This research objective is to develop a simplified methodology for generating a test set of bearing vibration signals reflecting various types and stages of faults, and to check its applicability for testing and verifying vibration diagnostics algorithms. The proposed approach is aimed at overcoming the limitations of existing modeling methods related to high computational complexity and insufficient adequacy of reproducing real operating conditions of the system.
For this purpose, a method was developed that combines experimental recording of the initial signal from equipment in good condition and finite element modeling of the system's behavior in the presence of faults. Based on the modeling, a sequence of pulses was obtained that simulated the effect of bearing damage. These pulses were added to the initial signal, creating a set of combined signals corresponding to different stages of fault development.
This approach provides the formation of a standardized and easily reproducible dataset that can be used for testing and comparative evaluation of various vibration diagnostics methods. The proposed method of simulating faulty signals is a promising direction for the development of vibration diagnostics and can be useful for various industries where the reliability and durability of equipment are important.
Materials and Methods. The development of a method for obtaining a set of signals from a bearing with different stages of fault development includes the following stages: obtaining a correct signal experimentally, creating a model of the bearing being studied, simulating the fault on the model, obtaining a sequence of fault pulses, and mixing this sequence with a real correct signal.
Obtaining a correct signal from a laboratory setup is advisable because it is difficult to take into account numerous factors affecting the real signal during modeling, such as noise from the equipment itself, noise from the measuring device, the existing imbalance of the equipment shafts, etc.
To compare the real and simulated signals, signals from bearings with faults were also obtained on the laboratory setup. To obtain the pulse sequence, finite element modeling (FEM) was used, which is one of the most efficient and widely used approaches to the numerical analysis of mechanical systems and structures [10]. The pulse sequences obtained using FEM were added to the real correct signal to form signals with a fault.
1. Obtaining a correct signal experimentally
The object of the study was a single-row radial ball bearing with a seal type 180603 as per GOST 8882–751. The geometric characteristics of this bearing are given in Table 1.
Table 1
Geometric Characteristics of Rolling Bearings
|
Characteristic, dimensions |
Designation, formula |
Value |
|
Overall dimensions |
||
|
External diameter, mm |
D |
47 |
|
Internal diameter, mm |
d |
17 |
|
Width, mm |
B |
19 |
|
Dimensions of rolling elements |
||
|
Diameter, mm |
db |
9.5 |
|
Quantity |
z |
6 |
|
Contact angle, rad |
β |
0 |
|
Angular pitch of rolling elements, rad |
g = 2π/z |
π/3 |
|
Diameter of the circle passing through centers of rolling elements, mm |
D0 = (D+d)/2 |
32 |
|
Initial radial clearance, µm |
g |
8–15 |
|
Dimensions of rolling tracks |
||
|
Minimum thickness along the gutter, mm |
h = [(D–d)/2–db]/2 |
2.750 |
|
Diameter of the outer track, mm |
do = D–2×h |
41.500 |
|
Diameter of the inner track, mm |
di = d+2×h |
22.500 |
|
Radius of cross section, mm |
r = 0,515×db |
4.893 |
The bearing diagram is shown in Figure 1.
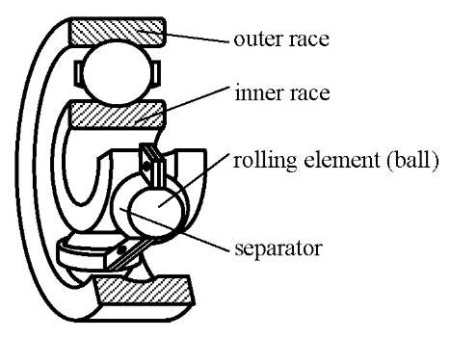
Fig. 1. Rolling bearing diagram
Bearings of this type are installed in the supports of a laboratory setup, which simulates the simplest rotary machine and basically represents a rotor on two supports. As in any real machine, the setup diagram contains manufacturing faults, such as static and dynamic imbalance, skew and tilt of the axes, which brings the operating conditions of the bearing setup closer to real ones.
Structurally, the laboratory setup, whose diagram is shown in Figure 2, consists of a base platform on which two supports and an asynchronous electric motor of the 4A80A type with a power of 1.1 kW and a nominal rotation frequency of 1000 rpm are mounted. A shaft with a flywheel rotates in the supports on rolling bearings. The shaft is connected to the motor through a coupling.
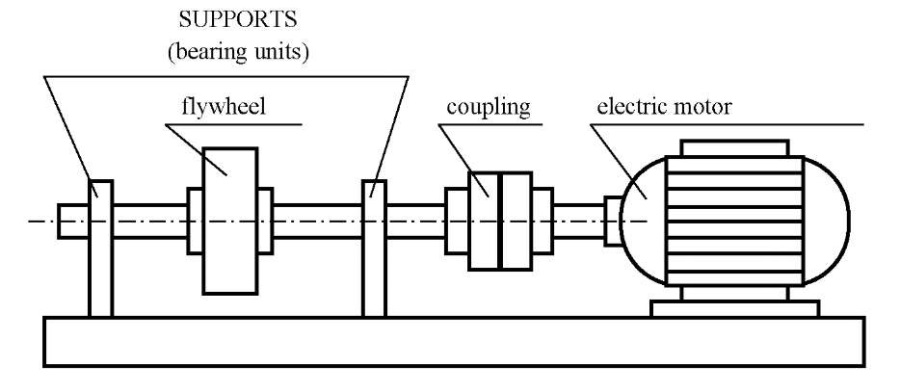
Fig. 2. Laboratory setup diagram
Due to the presence of friction in the bearings, the rotation frequency of the laboratory setup rotor is slightly different from the nominal rotation frequency of the engine and is 995 rpm, or 16.58 Hz, or 104.2 rad/s. A new, correct bearing is placed in the right support of the setup (closest to the engine and less accessible). The bearing under study is located in the left support, farthest from the engine, in the radial vertical direction.
For the experimental study of rolling bearing vibrations, the measuring system shown in Figure 3 was used. The measuring system included a piezoelectric accelerometer, a signal amplifier, an oscilloscope, an analog-digital converter (ADC), and a computer. In addition, to calibrate the measuring system, a signal generator was connected instead of the accelerometer and amplifier.
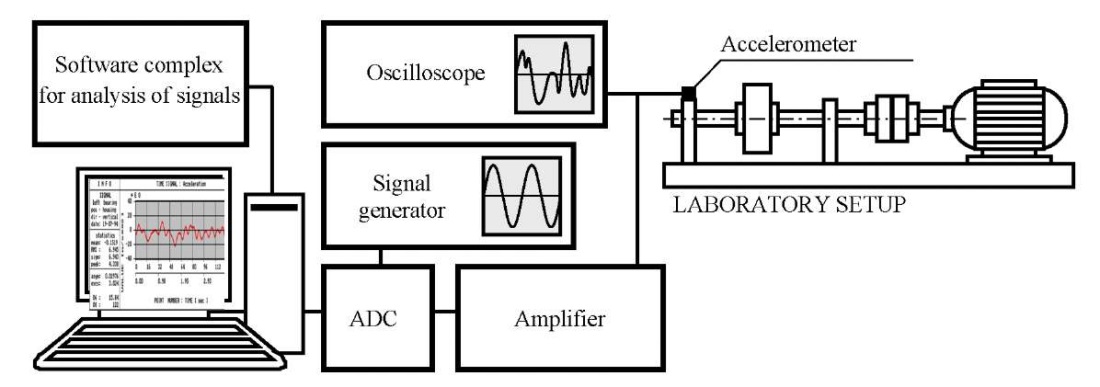
Fig. 3. Measuring system
Three bearings of type 180603 as per GOST 8882–752 were installed sequentially in the left support of the laboratory setup:
Vibration acceleration signals were recorded from each of the listed bearings with a sampling frequency of 16 kHz and a duration of 0.12 seconds.
2. Construction of a bearing model using the finite element method
The model of a healthy rolling bearing placed in the support of the laboratory setup is shown in Figure 4. The model is constructed using Plane162 elements. The elastic support of the laboratory setup is rigidly fixed to the base. A bearing is inserted into the support — the support and the outer race of the bearing have common nodes along the contact line. The shaft and the inner race of the bearing are connected in a similar way. The outer and inner races of the bearing are elastic. The shaft and separator are rigid. The rolling elements are modeled as follows: the central part of the ball is rigid; the periphery is elastic.
All elastic elements of the model use a material with the following properties: E = 210 GPa; μ = 0.33; ρ = 7850 kg/m³. Rayleigh damping is introduced into the material.
Loads on the model:
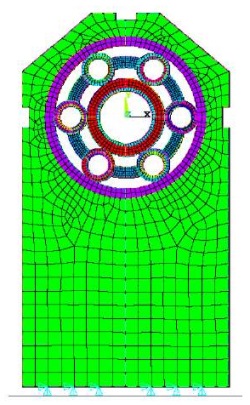
Fig. 4. Bearing model based on Plane162 elements
To ease the task in a computational sense, the following simplifications of the model were introduced.
The calculation feature of the model under consideration is that for subsequent processing of the calculated vibration acceleration signal (in particular, for applying the fast Fourier transform to it), it is required that the signal recording step in time be constant.
3. Simulation of a local fault of the outer race of a bearing
The objective of the experiment-calculated study is to obtain vibration signals of a bearing for different degrees of development of a local fault of the outer race of a rolling bearing. The problem is solved through superimposing a sequence of short-term, rapidly decaying “single pulses” caused by the rolling element hitting a fault (pit) on the measured signal of a healthy bearing. The sequence of pulses is obtained using the FEM model.
The depth of the chipping pit is considered equal to the depth of the dangerous point in the contact zone of the rolling element and the track when the endurance condition is violated — reaching equality of the amplitude value of the maximum equivalent stress in the contact of the rolling element and the track to the endurance limit of the material — steel ШХ15:
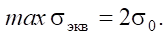 (1)
(1)
The fatigue limit of steel ШХ15 GOST 801–793 during heat treatment of the type “quenching at 840°С in oil and tempering at 300°С”, used for ball bearings, is σ₋₁ = 650 MPa. However, the fatigue limit σ₋₁ for a symmetrical stress cycle is not suitable for contact strength calculations, since the contact stress cycle is zero (pulsating). The fatigue limit in a zero-to-tension cycle σ₀ is determined using a schematized diagram of limiting amplitudes, linking the average cycle stress σₘ and its amplitude stress σa = σ–1 – ψσₘ, where coefficient ψ = 0.2–0.3 for alloy steels. From which:
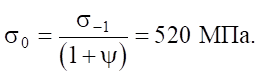 (2)
(2)
To determine the maximum equivalent stress, we consider the stress state at a point located at depth z below the center of the elliptical contact area. We introduce the coordinate system Cxyz: C — center of the elliptical contact area, z axis is perpendicular to the contact area, x axis is directed along the major semi-axis of the contact area, y axis is directed along the minor semi-axis of the contact area. The semi-axes of the contact area are: major — a, minor — b. For ease of writing formulas, we denote: a/b = β, z/a = ζ.
In areas parallel to the coordinate planes, the shear stresses are equal to 0, the normal stresses are the main ones and are determined by the following formulas:
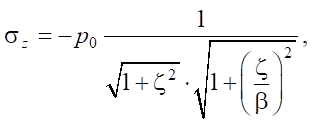 (3)
(3)
 (4)
(4)
 (5)
(5)
where K(e), L(e) — complete elliptic integrals depending on eccentricity e of the elliptical contact area of the rolling element and the bearing race.
The eccentricity of the contact area e, the greatest intensity of pressure between the contacting bodies p0, the minor semi-axis of the elliptical contact area are found from the Hertz problem of contact between spherical rolling elements and a toroidal bearing race.
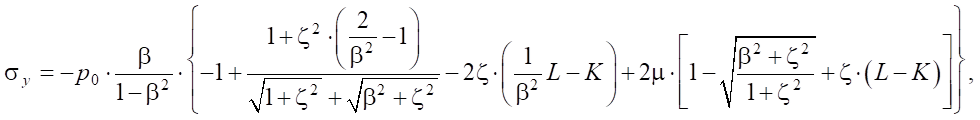
The equivalent tensile stress is determined from (3), (4) and (5) using the Huber-Mises strength hypothesis:
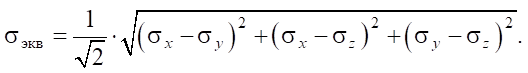 (6)
(6)
According to the calculation results using formulas (1), (2) and (6) for the bearing under consideration, the depth of the chipping pit on the inner raceway was 0.56 mm, on the outer raceway — 0.60 mm. Assuming the shape of the chipping pit is hemispherical, its transverse size (diameter) is considered equal to twice the depth.
In the flat model of a healthy rolling bearing, we introduce a fault in the form of a V-shaped notch on the outer raceway (Fig. 5). We round off the width and depth of the fault and take them equal to 0.5 mm.
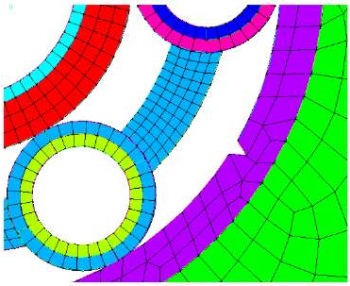
Fig. 5. Bearing outer race fault model
Such a change in the model of a healthy bearing can describe a single chipping pit. Moreover, it is practically impossible to obtain an experimental vibration signal for a single chipping pit due to the long duration and labor intensity of the experiment. A local fault of double width corresponding to a “double” chipping pit — two closely located pits that merged into one — was also considered. Using these models in the LS DYNA program, vibration acceleration signals were calculated in the vertical direction of the upper support point lying on the symmetry axis.
The calculation was carried out for the following parameters:
4. Processing a set of signals
As a result of the measurement and simulation techniques described above, a set of vibration signals was generated, including three signals measured on a laboratory setup and two signals obtained by mixing the simulated fault pulses with the real signal of a healthy bearing. The combined signals are intended to fill gaps in the sample and compensate for the lack of experimental data on bearings with an early-stage fault.
Fast Fourier transform was used to analyze the time and frequency characteristics of vibration signals, which allowed us to obtain amplitude spectra in the frequency domain. Spectrum analysis was performed in a wide frequency range (0–8 kHz).
To isolate pulses caused by local faults, the signals were filtered in an octave frequency band of 5.4 kHz. The resulting narrowband signals were used to identify fault pulses and calculate their maximum amplitudes.
The average value of the maximum pulse amplitudes was calculated as the arithmetic mean for all selected pulses in a narrowband signal. This parameter was used to quantify the severity of the fault.
The following statistical parameters were calculated for quantitative evaluation and comparison of signals: root mean square (RMS) of vibration acceleration, peak factor, and excess coefficient. The selection of these parameters was validated by their efficiency in identifying local bearing faults [11][12].
RMS was calculated using the following formula [13]:
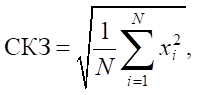 (7)
(7)
where xi — i-th vibration acceleration value, N — number of signal samples.
The peak factor was defined as the ratio of the maximum value of the signal to the RMS value [14]:
 (8)
(8)
where x — vibration acceleration values.
The excess coefficient was calculated using the formula for a large sample (N > 100) [15][16]:
 (9)
(9)
where  denotes the arithmetic mean value of vibration acceleration, s — standard deviation.
The calculated parameters were used to construct a correspondence table for the degree of development of the bearing outer race fault, which made it possible to assess the likelihood of the simulated signals and their suitability for testing vibration diagnostics methods.
Research Results
1. Measured signals
Three signals were obtained, corresponding to different states of the bearing: healthy condition, developed fault (multiple pits), emergency condition (race crack). Figure 6 shows the shapes of vibration signals in the time domain (1 — healthy rolling bearing; 2 — faulty bearing with developed chipping of the rolling raceways; 3 — bearing under the emergency condition with a crack in the outer race).
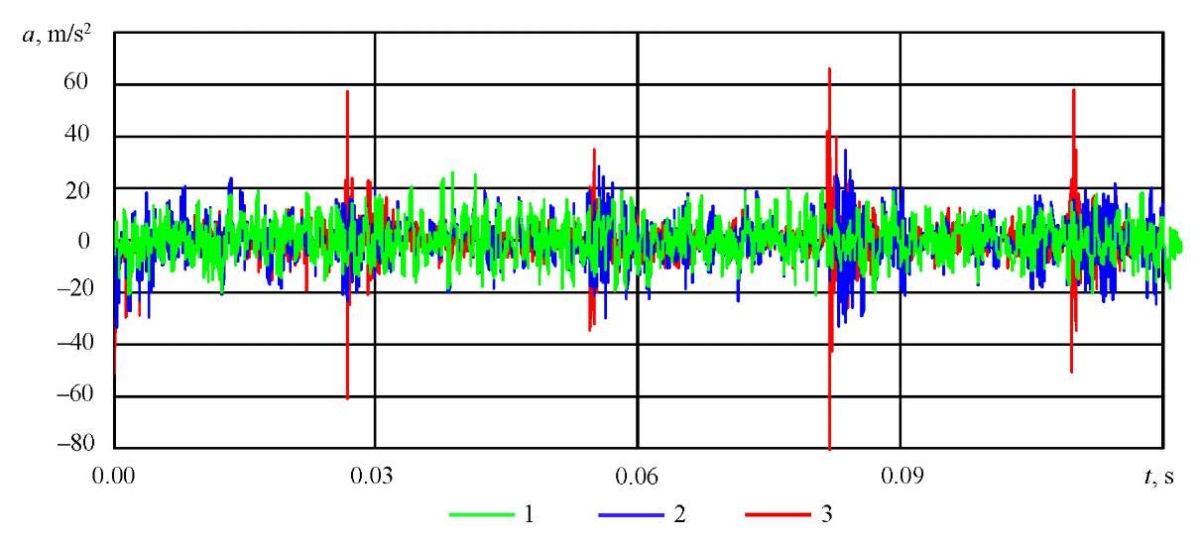
Fig. 6. Measured vibration acceleration signals
Figure 7 shows the amplitude spectra of signals in the frequency domain (1 — healthy rolling bearing; 2 — faulty bearing with developed chipping of the rolling raceways; 3 — bearing under the emergency condition with a crack in the outer race). As the fault develops, an increase in amplitudes is observed in the high-frequency region (about 5.4 kHz), and sequences of short-term pulses appear in the signals.
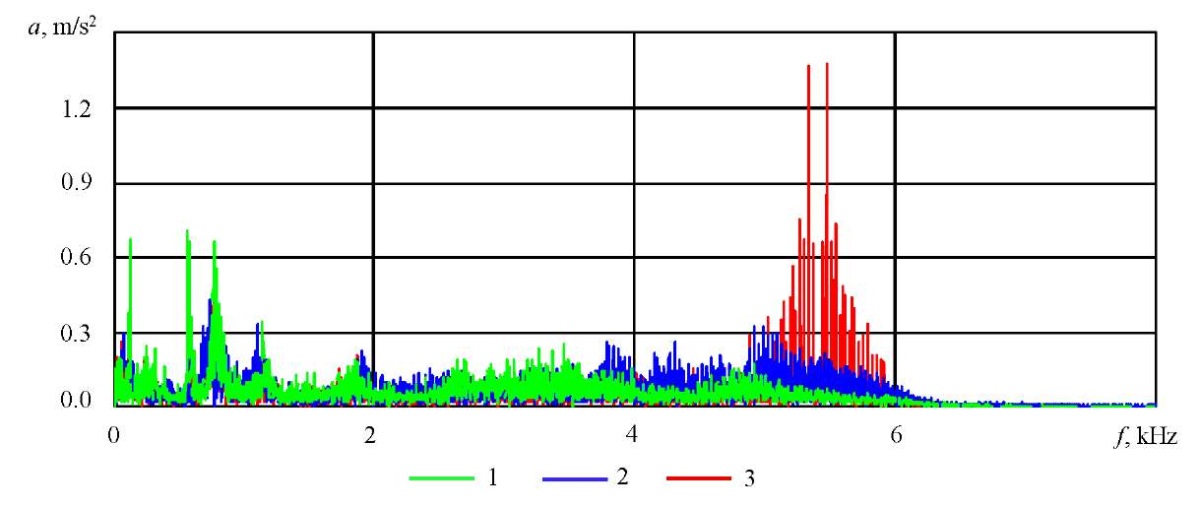
Fig. 7. Amplitude spectra of measured vibration signals
After filtering in the octave band of 5.4 kHz, the fault pulses were isolated. Narrowband signals are shown in Figures 8 and 9.
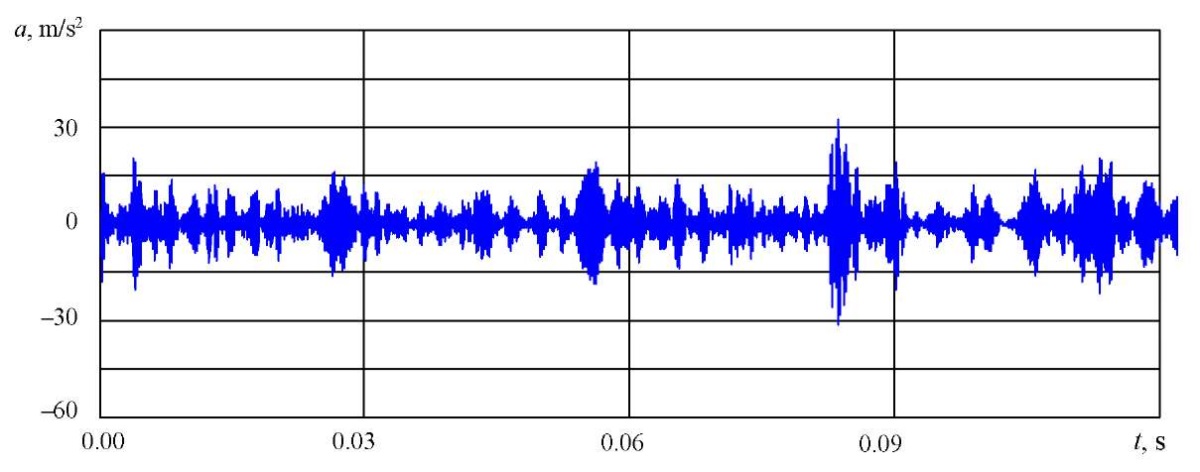
Fig. 8. Narrowband vibration signal of a rolling bearing with developed chipping of the rolling raceways
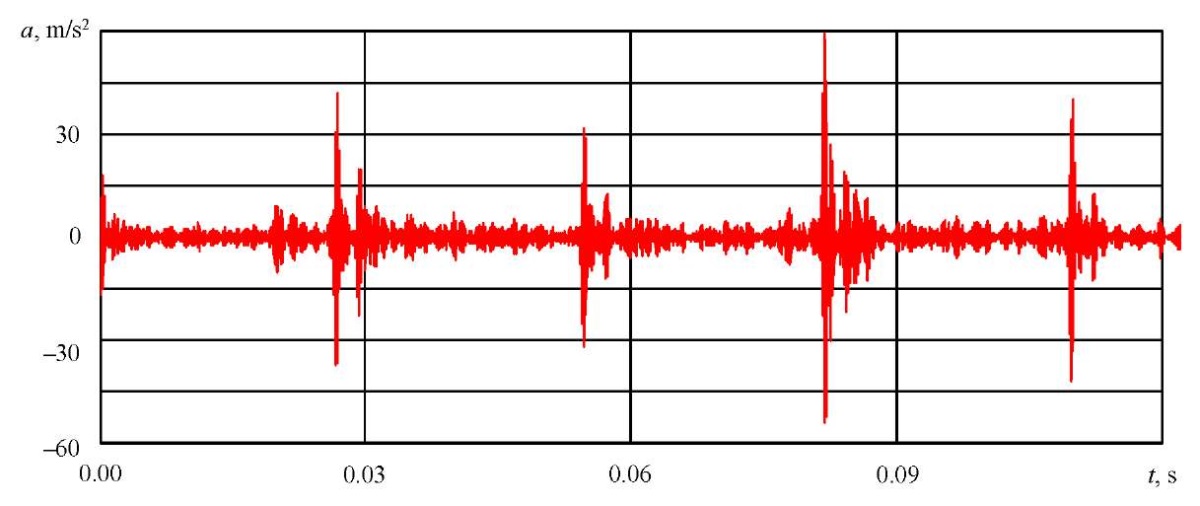
Fig. 9. Narrowband vibration signal of a rolling bearing with a crack in the outer race
The average value of the maximum pulse amplitudes was: 24.3 m/s² — for a large multiple pit (a sequence of the strongest pulses in a bearing signal with chipping); 39.8 m/s² — for a race crack.
2. Combined signals
The pulses obtained through dynamic simulation of the FEM model are shown in Figure 10. The correct signal from the setup, with which the pulses obtained were mixed, is shown in Figure 11.
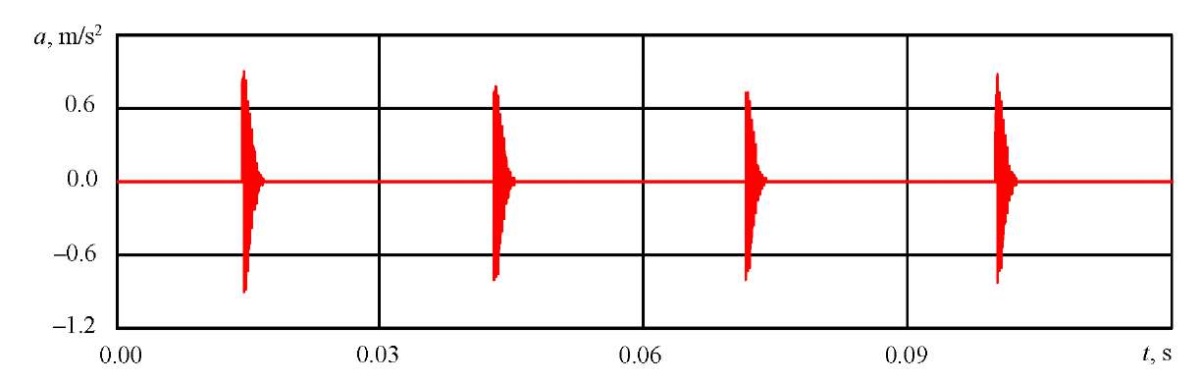
Fig. 10. Sequence of received pulses

Fig. 11. Measured vibration signal of healthy bearing
Two combined signals were generated, corresponding to the early stages of the fault: with a single and double chipping pit. Figure 12 shows the time representations of the signals obtained (1 (green line) — vibration signal of a healthy bearing; 2 (blue line) — combined vibration signal of a faulty bearing with a single chipping pit; 3 (red line) — combined vibration signal of a faulty bearing with a double chipping pit.
![]()
Fig. 12. Combined vibration signals of a rolling bearing for different degrees of fault development
The signal with a single pit visually differs little from the healthy one due to the relative smallness of the pulses.
After filtering in the 5.4 kHz band, the fault pulses were isolated. Figure 13 shows a narrowband signal for a single pit.
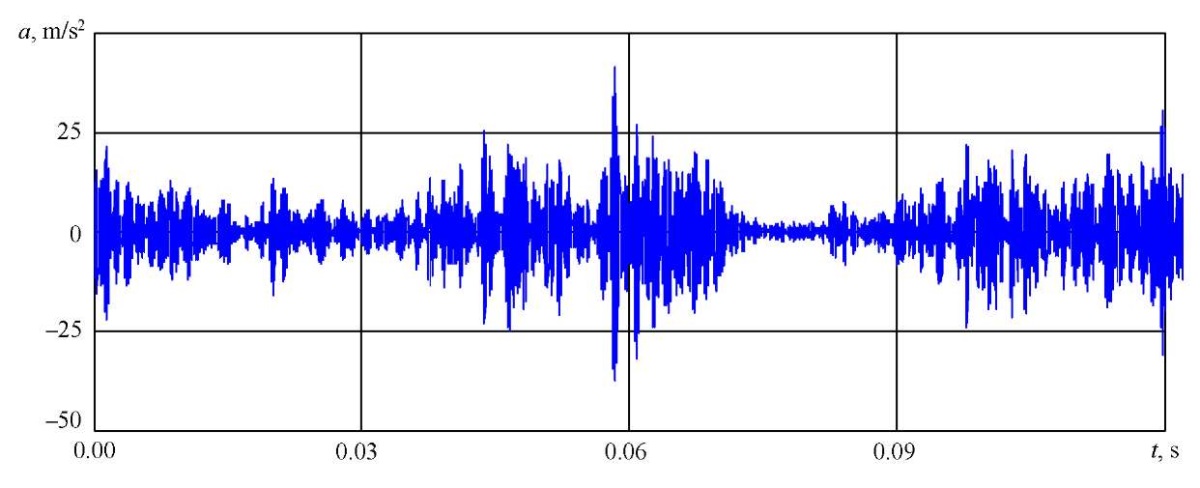
Fig. 13. Narrowband signal of bearing with single chipping pit
The average value of the maximum pulse amplitudes was:
For all signals, the following statistical parameters were calculated:
The results are presented in Table 2.
Table 2
Statistical Analysis Results of Calculated Vibration Signals for Healthy and Faulty Rolling Bearings
|
Signal |
Technical condition |
A, m/s² |
RMS |
Pf |
E |
|
Measured |
Healthy condition, no faults |
0 |
6.81 |
3.04 |
3.03 |
|
Combined |
Faulty, early stage of development — single pit |
10 |
6.86 |
3.86 |
3.10 |
|
Combined |
Faulty, developed fault — double pit |
15 |
6.93 |
4.49 |
3.27 |
|
Measured |
Faulty, developed fault — multiple pit |
25 |
7.15 |
5.64 |
4.30 |
|
Measured |
Emergency, race crack |
40 |
7.67 |
6.96 |
8.09 |
Figure 14 shows the change in the normalized values of statistical parameters depending on the degree of fault development.
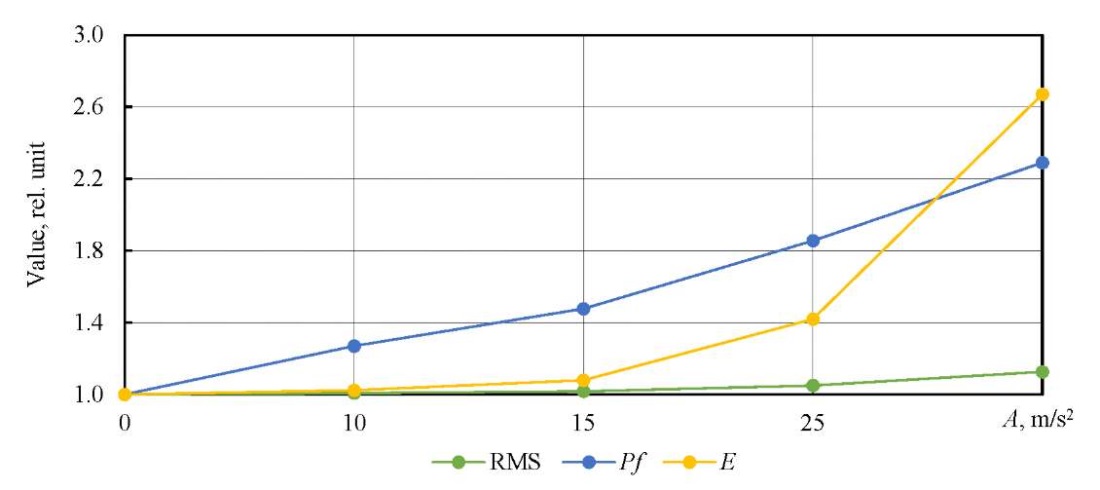
Fig. 14. Growth of statistical parameters depending on the fault development
Discussion. The main objective of this study was to develop a methodology for generating a set of bearing vibration signals at various stages of development of a local fault of the outer race. The proposed approach, combining experimental data and numerical modeling, made it possible to fill in the gaps in the experimental base, especially at the early stages of the fault, whose acquisition under laboratory conditions was difficult due to the lack of appropriate samples.
The analysis of the signals obtained has shown that as the fault develops, characteristic changes are observed in both the time and frequency domains. Sequences of short-term pulses appear in the signals, while in the spectra, there is an increase in amplitudes in the vicinity of the bearing unit's natural frequency — ~5.4 kHz. These changes are due to the impact nature of the interaction of the rolling elements and the faulty surface. When a fault enters the contact zone, an impact occurs that excites the unit's own vibrations. The amplitude of these vibrations is modulated by the flicker frequency of the fault, which manifests itself in the form of decaying pulses in the narrowband signal.
Statistical analysis revealed a steady increase in key diagnostic parameters — RMS, peak factor and excess coefficient — as the damage degree increased, which is consistent with the expected behavior of the vibration signal during the development of a local fault. However, a key aspect of the analysis was to check the likelihood of the simulated signals included in the set to compensate for the lack of experimental data at the early stages of the fault.
The analysis has shown that the parameter values for combined signals logically fit into the general trend observed in the measured signals. Thus, for a signal with a single pit (early stage), the RMS was 6.86 m/s², the peak factor was 3.86, and the excess was 3.10; for a signal with a double pit, it was 6.93 m/s², 4.49, and 3.27, respectively. These values are between the healthy state and the developed fault, indicating a consistent and physically based change in the signal with an increase in the degree of damage.
Thus, the simulated signals not only fill the gaps in the set, but also retain the correct dynamics of changes in diagnostic parameters, which confirms their validity and suitability for use as reference signals in the development and testing of vibration diagnostics methods. However, the analysis of the trend characteristic has shown that the growth of the parameters does not correspond to the threshold values specified in GOST R ISO 20816–1–20214 standard (an increase of 2.5 times for a faulty state and 10 times for an emergency). This suggests that unified thresholds may not be accurate enough for specific types of equipment, and that individual calibration of diagnostic models is required on the basis of experimental or simulated data. The proposed methodology allows such calibration to be performed without the need for long-term collection of fault statistics or intentional damage to equipment.
An important advantage of the approach is the ability to simulate the development of a fault for a specific bearing and operating conditions. However, the method has limitations. In particular, creating a finite element model requires significant time and skill resources. To reduce labor intensity, the key characteristics of the pulses generated by the fault are analyzed:
The amplitude distribution and attenuation pattern correspond to those observed in real signals with a crack in the race. This indicates that the pulse generated by the fault can be described analytically, which makes it possible to replace resource-intensive FEM modeling with simulating predetermined pulse shapes and thereby significantly simplify and speed up the signal generation procedure.
Thus, the proposed technique not only solves the problem of forming a complete set of signals for vibration diagnostics, but also opens up the prospect of creating individualized diagnostic models adapted to specific equipment. In the future, it is planned to develop a simplified algorithm for generating pulses based on the obtained characteristics, which will make the method more accessible for practical application.
Conclusion. During the research, a method for generating a test set of vibration signals from rolling bearings was developed, combining experimental data and numerical modeling. The proposed approach provides reproducing various stages of the development of a local fault in the outer race, including early ones for which there are no experimental samples, without the need for long-term data accumulation or equipment damage.
The analysis has shown that the simulated signals fit correctly into the general trend of changes in diagnostic parameters (RMS, peak factor, excess), which confirms their validity and suitability for testing vibration diagnostics methods. The resulting set of signals can serve as a standardized basis for comparative evaluation of diagnostic algorithms.
The practical significance of the work involves reducing the costs of experimental research, accelerating the verification of diagnostic models, and increasing the reliability of assessing the technical condition of equipment.
In the future, it is planned to simplify the generation of pulses based on the identified mathematical characteristics, expand the methodology to other types of bearings and faults, as well as integrate it with data analysis techniques to create solutions in the field of predictive maintenance.
1. GOST 8882–75. Single Row Radial Sealed Ball Bearings. Technical Conditions. Electronic Fund of Legal and Regulatory Documents. URL: https://base.garant.ru/5926172/ (accessed: 09.06.2025).
2. GOST 8882–75. Single Row Radial Sealed Ball Bearings. Technical Conditions. Electronic Fund of Legal and Regulatory Documents. URL: https://base.garant.ru/5926172/ (accessed: 09.06.2026).
3. GOST 801–79. Bearing Steel.
4. GOST R ISO 20816–1–2021. Mechanical Vibration. Measurement and Evaluation of Machine Vibration. Electronic Fund of Legal and Regulatory Documents. URL: https://docs.cntd.ru/document/1200182677 (accessed: 20.05.2025).
1. Nguyen Duc Thuan, Hoang Si Hong. HUST Bearing: A Practical Dataset for Ball Bearing Fault Diagnosis. arXiv. 2023. https://doi.org/10.48550/arXiv.2302.12533
2. Jing Liu, Yimin Shao. A New Dynamic Model for Vibration Analysis of a Ball Bearing due to a Localized Surface Defect Considering Edge Topographies. Nonlinear Dynamics. 2015;79:1329–1351. https://doi.org/10.1007/s11071-014-1745-y
3. Halmos F, Wartzack S, Bartz M. Investigation of Failure Mechanisms in Oil-Lubricated Rolling Bearings under Small Oscillating Movements: Experimental Results, Analysis and Comparison with Theoretical Models. Lubricants. 2024;12(8):271. https://doi.org/10.3390/lubricants12080271
4. Jain PH, Bhosle SP. Mathematical Modeling, Simulation and Analysis of Non-Linear Vibrations of a Ball Bearing due to Radial Clearance and Number of Balls. Materials Today: Proceedings. 2023;72(3):927–936. https://doi.org/10.1016/j.matpr.2022.09.093
5. Menck O. The Finite Segment Method–A Numerical Rolling Contact Fatigue Life Model for Bearings Subjected to Stochastic Operating Conditions. ASME Journal of Tribology. 2023;145(3):031201. https://doi.org/10.1115/1.4055916
6. Wrzochal M, Adamczak S. The Problems of Mathematical Modelling of Rolling Bearing Vibrations. Bulletin of the Polish Academy of Sciences: Technical Sciences. 2020;68(6):1363–1372. https://doi.org/10.24425/bpasts.2020.135398
7. Lihai Chen, Ao Tan, Lixiu Yang, Xiaoxu Pang, Ming Qiu. Defect Size Evaluation of Cylindrical Roller Bearings with Compound Faults on the Inner and Outer Races. Mathematical Problems in Engineering. 2022;2022(2):1–12. https://doi.org/10.1155/2022/6070822
8. Malanchuk Y, Moshynskyi V, Korniienko V, Malanchuk Z. Modeling the Process of Hydromechanical Amber Extraction. E3S Web of Conferences. 2018;60:00005. https://doi.org/10.1051/e3sconf/20186000005
9. Ali Safian, Hongsheng Zhang, Xihui Liang, Nan Wu. Dynamic Simulation of a Cylindrical Roller Bearing with a Local Defect by Combining Finite Element and Lumped Parameter Models. Measurement Science and Technology. 2021;32(12):125111. https://doi.org/10.1088/1361-6501/ac2317
10. Tianhe Wang, Lei Chen, Hong Lu, Shaojun Wang, Zhangjie Li, Wei Zhang, et al. Finite Element Dynamic Model and Vibration Signal Simulation of Rolling Bearing with Local Faults. In: Proc. 18th International Manufacturing Science and Engineering Conference. New York NY: ASME. 2023;2:105504. https://doi.org/10.1115/MSEC2023-105504
11. Gururaj Upadhyaya, Kumar HS. A Comparative Study of Statistical Features Used in Rolling Element Bearing Health Diagnosis Using Six Sigma Approach. In: Proc. 2nd Indian International Conference on Industrial Engineering and Operations Management. Southfield, MI: IEOM Society International; 2022. https://doi.org/10.46254/IN02.20220244
12. Jain PH, Bhosle SP. Study of Effects of Radial Load on Vibration of Bearing Using Time-Domain Statistical Parameters. IOP Conference Series: Materials Science and Engineering. 2021;1070:012130. https://doi.org/10.1088/1757-899X/1070/1/012130
13. Trufanov NN, Churikov DV, Kravchenko OV. Application of Spectral Analysis Methods for Data Pre-processing of Anomaly Detection Problem of Vibration Diagnostics in Non-destructive Testing. Journal of Physics: Conference Series. 2021;2127:012028. https://doi.org/10.1088/1742-6596/2127/1/012028
14. Garad A, Sutar KB, Shinde VJ, Pawar AC. Analysis of Vibration Signals of Rolling Element Bearing with Localized Defects. International Journal of Current Engineering and Technology. 2017;7:37–42.
15. Tetter V, Tetter A, Denisova I. Researching the Possibility of Determining the Technical Condition of Rolling Bearings by the Kurtosis Factor. In: Proc. International Russian Automation Conference (RusAutoCon). New York City: IEEE; 2023. P. 149–153. https://doi.org/10.1109/RusAutoCon58002.2023.10272799
16. Puzyr V, Mykhalkiv S. Classification of the Technical Condition of Rolling Bearing by the Scalar Indicators and Support Vector Machines. Progresivna tehnìka, tehnologìâ ta ìnženerna osvìta. 2023.
Zoya A. Kolosova, Postgraduate student of the Automation and Control Department
76, Lenin Ave., Chelyabinsk, 454080
Scopus ID: 59198139900
Olga P. Kolosova, Cand.Sci. (Eng.), Professor of the Technical Mechanics Department
76, Lenin Ave., Chelyabinsk, 454080
Dmitry A. Shnayder, Dr.Sci. (Eng.), Professor of the Automation and Control Department76, Lenin Ave., Chelyabinsk, 454080
Scopus Author ID: 57219166252
ResearcherID: R-6261-2016
A combined method for generating bearing vibration signals is developed on the basis of the experience and finite element modeling. This model-based approach provides the generation of pulse sequences corresponding to different stages of a local defect. The resulting combined signals accurately reproduce the growth of statistical diagnostic parameters. This method compensates for the lack of experimental data at the early stages of a defect without damaging equipment. The resulting signal set is suitable for testing and validating vibration diagnostic algorithms.
Kolosova Z.A., Kolosova O.P., Shnayder D.A. Obtaining a Set of Vibrational Signals from Rolling Bearings with Varying Degrees of Local Defect Development in the Outer Ring. Advanced Engineering Research (Rostov-on-Don). 2025;25(3):242-255. https://doi.org/10.23947/2687-1653-2025-25-3-242-255. EDN: CRISFJ

Advanced Engineering Research (Rostov-on-Don)
ISSN 2687-1653 (Online)
Contact with: Publisher / Editorial Office of the Journal
Publisher: Don State Technical University - DSTU, Rostov-on-Don, Russia - https://donstu.ru/en/
Editor-in-Chief: Alexey N. Beskopylny, Dr.Sci. (Eng.), Professor, Vice-Rector, Don State Technical University (Rostov-on-Don, Russia)
Don State Technical University
1, Gagarin Sq., Rostov-on-Don, 344003, Russia
tel.: +7 (863) 2738-372, e-mail: vestnik@donstu.ru
16+
Processing of personal data