Contents
Scroll to:
https://doi.org/10.23947/2687-1653-2025-25-4-2202
EDN: TVJRQI
Scroll to:
Introduction. The implementation of high-precision attitude control systems of a new generation with improved technical characteristics remains a key task in precision instrumentation — this is required for the reliable operation of moving objects with a long service life. One of the promising ways is the use of sensors based on the Bryan effect (hemispherical resonator gyroscopes, HRG),), which show significant advantages in stability of characteristics under external factors. Over the past 10 years, foreign and domestic research has reached noticeable success in increasing the target parameters of HRG, however, certain improvement problems remain open. Thus, in the literature, attention is paid to reducing the errors in measuring the HRG through compensating for the impact of imperfections of the resonator, but more often these methods are applicable at stages after geometry generation. Methods for early identification of material inhomogeneities (density variation) during workpiece inspection are insufficiently developed, creating a gap in the process chain and reducing the efficiency of subsequent balancing and calibration. The objective of this study is to develop a method for identifying resonator density variations at an early stage of the process — during workpiece inspection.
Materials and Methods. An optically transparent material is considered – fused quartz glass, which is the most common material for making a HRG resonator, in particular, the KU-1 brand (foreign analogs — Corning HPFS 7980, JGS1). The identification method is based on the relationship of the optical properties of quartz glass (absorption coefficient) with the desired density distribution over the volume of the workpiece. A virtual experiment was conducted, which consisted in the formation and resolution of a system of linear algebraic equations (SLAE) based on the measurements series results of a light beam intensity passing through a workpiece. A polynomial approximation was used to describe the density distribution in order to increase the robustness of the method. The SLAE roots were obtained through finding a pseudosolution by the least square method based on the singular value decomposition.
Results. A method for identifying the density variation of quartz glass at the stage of quality control of the technological workpiece of the HRG resonator was developed. The desired density distribution of quartz glass over the volume of the workpiece was obtained, coinciding with the “true” one — the difference was no more than 5%. The sensitivity of the method to the presence of macrodefects in the volume of the workpiece (pores, bubbles, etc.) was assessed.
Discussion. The results show that the proposed method can effectively control the density variation of the workpieces and optimize the resonator production, thereby improving the efficiency of the processes and minimizing the impact of imperfections on their characteristics. Virtual experiments have demonstrated that measuring the light beam intensity passing through the workpiece allows for the accurate reconstruction of the absorption coefficient and density distribution with an accuracy of at least 0.005%. The developed system of linear algebraic equations (SLAE) makes it possible to determine these parameters by volume. The paper highlights some features related to solving uncertain SLAE. Particular attention is paid to the need to control the ratio between the number of roots and unknowns to obtain a stable solution.
Conclusion. The proposed method for identifying the density variation of quartz glass at the stage of workpiece quality control in the production of HRG resonators demonstrates high efficiency and accuracy. The presented method has high accuracy for describing the distribution function, and is also flexible in terms of obtaining the optimal dimension of the SLAE, which is directly related to the number of experiments performed. The obtained results confirm the applicability of the material optical properties for controlling the density distribution over the volume, which allows for improved control of workpieces and optimization of production processes. The required measurement accuracy, determined by the level of density variation that affects the HRG characteristics, is practically achievable, which indicates that the method can be used in the manufacturing process. This approach can be applied in future research and development of highprecision systems, which will contribute to progress in the precision instrumentation industry and improve the quality of manufactured products.
Shevchenko S.A., Popov I.A., Melnikov B.E. Optical Method for Material Imperfections Identification in the Resonator Workpiece of Hemispherical Vibratory Gyroscope. Advanced Engineering Research (Rostov-on-Don). 2025;25(4):311-323. https://doi.org/10.23947/2687-1653-2025-25-4-2202. EDN: TVJRQI
Introduction. Currently, the development of high-precision spatial position-determining systems (attitude control systems, ACS) based on sensors (hemispherical resonator gyroscopes, HRG), whose operating principle is linked to the elastic wave precession effect (the Bryan effect), remains relevant [1][2]. The urgency of using HRG to construct ACS for various purposes is primarily due to the obvious advantages of such devices compared to devices using other physical principles: better weight and size characteristics, resistance to mechanical stress, energy efficiency, longer service life and readiness time, etc. [3]. In the context of the tendency to increase the required assigned resource when creating new mobile objects, the listed advantages make it possible to increase the payload mass, optimize the layout and, more importantly, reduce the accumulated error of the ACS and the load on the energy systems.
With the development of design and modeling methods, as well as manufacturing technologies for HRG, their technical characteristics are also improving, which makes it possible to create ACS of various accuracy classes and, accordingly, apply them in a wide range of fields of science and technology, including space instrumentation [4]. A large number of works published by leading domestic research teams are devoted to the development, design and manufacturing technology of HRG [5]. This is stimulated both by the achievements of foreign companies in terms of the implemented technical indicators of HRG [6], and by the creation of ACS based on them [7].
Despite the fundamental research and advanced results of our compatriots and their students — Academicians V.F. Zhuravlev and D.M. Klimov [8], Professors B.S. Lunin, M.A. Basarab and V.A. Matveyev [9], I.V. Merkuriev [10], K.V. Shishakov [4] — as well as the achievements of foreign groups of D.D. Lynch [11], D. Roselle [12], B.J. Shaw [13], S. Zotov, A. Trusov and A. Shkel [14] — there remain directions and methods for further improvement of the HRG. This allows us to follow the advanced trend of modern precision instrument making — the development of high-precision ACS, based on various sensitive elements [1], [15], including on the basis of the HRG [16].
One of the directions is the minimization of the impact of imperfections in the main sensitive element of the HRG — the resonator [8] — on the key parameters of the product, in particular on the splitting of its operating natural frequency [9]. When discussing the impact of imperfections, the question arises of how to identify them. Most existing works and studies [3], [5] are devoted to assessing the level of imperfection and its compensation at the stages of mechanical and electrical balancing. However, there are practically no studies proposing an identification method at earlier stages of production, for example, during quality control of a workpiece. The ability to determine the distribution function of material properties (for example, density) by volume at the stage of choosing workpieces allows for a reduction in production costs through the selection based on the criterion of the permissible magnitude of the imperfection amplitude and the choice of the optimal direction of shaping. This, in turn, reduces the duration of the mechanical balancing process cycle and, consequently, reduces operating frequency splitting. The need to monitor inhomogeneity is further dictated by existing methods for assessing material quality, which are focused on its primary application — quartz glass is predominantly considered an optical material; therefore, the focus of monitoring is shifted toward the corresponding parameters.1 However, when considering quartz glass as the material for the sensing element of a HVG, it is advisable to control the properties and their distribution throughout the volume, which determine the dynamic characteristics (density, elastic modulus, etc.). In this regard, this paper proposes a method for identifying inhomogeneity that has not previously been used.
The objective of this study is to develop a method for identifying imperfections of the “inhomogeneity” type based on measuring the optical properties of a HVG resonator material, intended for use in the quality control stage of a resonator workpiece. This study tests the feasibility of determining the volumetric density distribution function by directly measuring the intensity of a light beam transmitted through the workpiece, given the existing relationship between density and the optical properties of quartz glass.
Materials and Methods. A KU-1 quartz glass cube with a 30 mm edge length was used as the test object (as part of a virtual experiment). Inhomogeneity across the volume of the cube was determined through a series of experiments measuring the intensity of a light beam passing through the cube. In this case, for simplicity, the transmission of a beam in the cross-section of the workpiece was considered (that is, a plane problem). Figure 1 shows the computational and experimental setup used to identify the imperfection in the form of inhomogeneity.
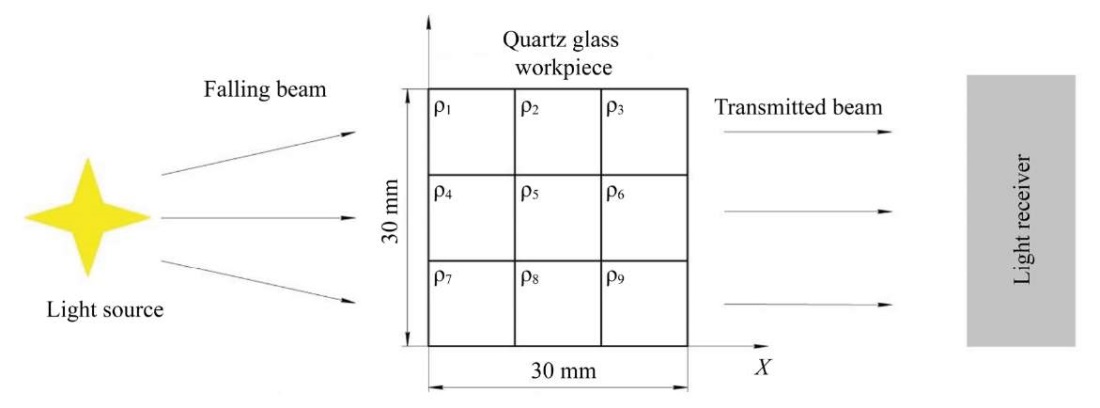
Fig. 1. Calculation and experimental scheme for identifying inhomogeneity
The method involved discretizing the workpiece cross-section into q elements, each of which had its own density value within a specified tolerance characteristic of the material. The minimum element size was determined by the minimum diameter of the light beam generated by the light source. To simplify the calculations, in each of the measurements it was assumed that the light beam fell along the normal to the surface of the workpiece. By generating a light beam of constant frequency (wavelength) and specified intensity, the transmitted light intensity was measured, which made it possible to determine the absorption capacity of the material. The wavelength was selected away from optical resonance to maintain the validity of the previously presented relationships for the non-resonant section [17]. The absorption coefficient value took into account the dimensions of the workpiece, which made it possible to record changes in the intensity of the light beam. As a result of measurements of the intensity of light transmitted through the workpiece, a system of linear algebraic equations (SLAE) was formed on the basis of Bouguer's law, whose solution provided obtaining the desired density distribution of the material.
It is known that within the framework of electromagnetic optics [18], the intensity of a light beam passing through a continuous medium can be described by the Bouguer-Lambert-Beer law (in the Gaussian system of units) [19]:

where δ — absorption coefficient; z — distance traveled by the light beam. Taking into account the dispersion of light — the dependence of the optical properties of a medium on the frequency of the transmitted electromagnetic wave — and using the Lorentz dispersion model, based on the oscillatory model of the atom, it is possible to determine the relationship between density and absorption coefficient:
where m and e — mass and charge of an electron excited by a light wave; c — lightspeed; ω0 — resonant frequency of the electron oscillations; ω — frequency of the light wave (excitation); Г — damping coefficient of the oscillations;  — number of atoms per unit volume (Na — Avogadro's number; M — molar mass; ρ — density of the medium).
Due to the directly proportional dependence of the absorption coefficient on density, its distribution by volume was subsequently considered, implying that the change in density could also be found.
To ensure the formation of SLAE, Bouguer's law is represented as:
where Iu, δh — intensity of the beam transmitted through the workpiece for the u-th experiment and the average value of the absorption coefficient for the h-th element in the u-th experiment, respectively; z = const — dimensions of the workpiece; I0 = const — intensity of the generated light beam. Note that a system of q elements with an equal number of elements on the edge was considered, from which it follows that the number of equations u  with the number of unknowns l = h = q. Writing the SLAE in matrix form, we obtain:

where Au×l — main matrix of the system; xl — vector of unknowns; bu — vector of free terms.
Assuming a continuous and smooth density distribution over the volume, the absorption coefficient distribution is represented as a two-dimensional polynomial of p-th degree. In this case, the number of unknowns will be independent of the number of elements and will be l = (p + l)². Conversely, the degree of system discretization and the number of elements will be determined by the steady-state solution to the SLAE and the corresponding required polynomial degree. In other words, it becomes possible to manipulate the data for solving an indefinite SLAE, which is important for analyzing the obtained results to provide finding an approximate solution.
Writing the Legendre polynomial using the Rodrigues formula [20] for each of the coordinates (x, y):
where t = (0, …, p) — constant; Pv, Pw — tensors of the first kind (v = w = (1, …, t + 1)); CVp, CWp — unknown coefficients of the polynomial; x(xh), y(yh) — coordinates of the h-th element, the desired distribution of the absorption coefficient is represented through the elementwise sum of the corresponding second-rank tensor:
A pseudosolution (approximate solution) of the resulting uncertain system of equations can be found by the least squares method [21]:

where A+ — Moore-Penrose pseudoinverse matrix, determined by the singular value decomposition (SVD) [21] of the underlying matrix A.
It should be noted that when finding δh, due to the properties of the Legendre polynomial used, in particular its orthogonality on the interval [ –1, 1], the origin of the coordinate system (X, Y) was determined at the geometric center of the workpiece, and the solution was found in dimensionless form by coordinate:

The computational assessment of the density distribution across the workpiece volume (virtual experiment) was conducted in the MATLAB software package. The results of solving SLAE of various dimensions are presented for the initial data shown in Table 1.
Table 1
Initial Data for Calculation
|
z, [m] |
I0, [W/m²] |
λ, [nm] |
ϰmin / ϰmax |
|
0.03 |
1000 |
200 |
5.768·10⁻⁹/5.432·10⁻⁹ |
Note: Values ϰmin / ϰmax are given in accordance with the nominal value for quartz glass2 and taking into account the results [22].
As the results of the experiment, and also for the possibility of monitoring the reliability of the sought solution, an array of data for Ii (intensity of the beam transmitting through the workpiece) was used, obtained for the following distribution of the absorption coefficient:
The distribution option selected for the example is due to the greatest impact of the 4th harmonic of the disturbance (inhomogeneity) on the splitting of the operating frequency of the HRG resonator [9].
Research Results. Figures 2–5 show comparison graphs of the obtained solutions to uncertain SLAE of different dimensions. In each figure (here and below for similar figures), the absorption coefficient distribution based on the experimental points (linearly connected) and associated with the discretization in the X-axis direction for the Y value is shown in green. The result of the SLAE solution, that is, a polynomial approximation, which is also true for distribution surfaces, is shown in blue. Index i at y in the figure captions denotes the i-th coordinate along axis y.
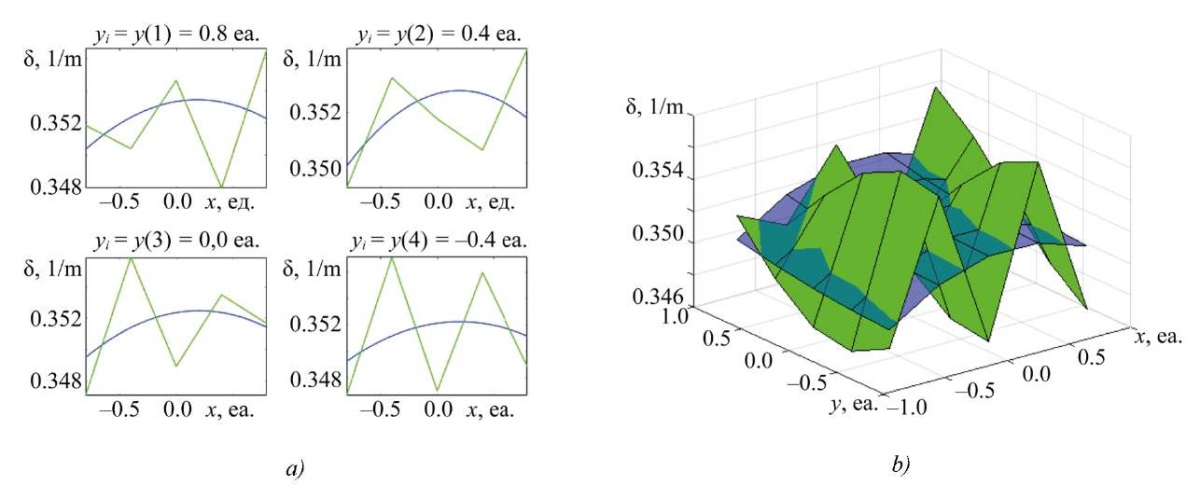
Fig. 2. Result of solving rectangular SLAE (p = 2; q = 25), dimension of matrix A — [ 10×9];
a — two-dimensional slice of the absorption coefficient distribution along x;
b — three-dimensional representation of the distribution of the absorption coefficient along x, y

Fig. 3. Result of solving rectangular SLAE (p = 4; q = 169), dimension of matrix A — [ 26×25];
a — two-dimensional slice of the absorption coefficient distribution along x;
b — three-dimensional representation of the distribution of the absorption coefficient along x, y
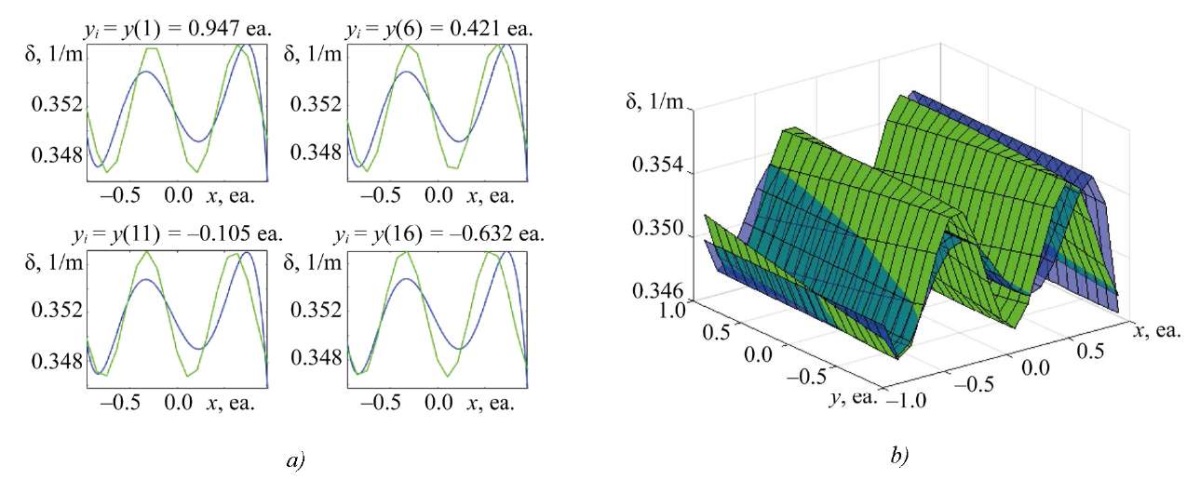
Fig. 4. Result of solving rectangular SLAE (p = 5; q = 361), dimension of matrix A — [ 38×36];
a — two-dimensional slice of the absorption coefficient distribution along x;
b — three-dimensional representation of the distribution of the absorption coefficient along x, y
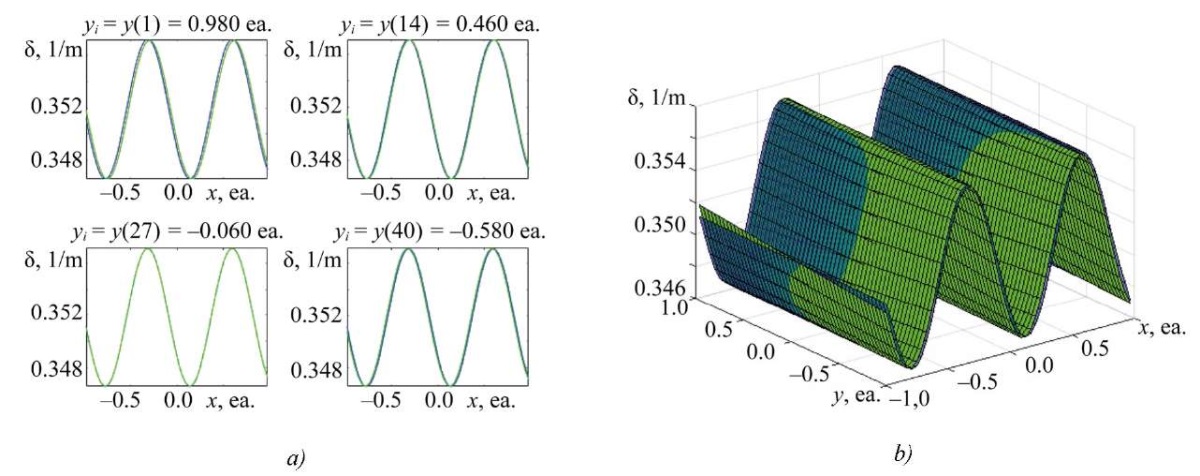
Fig. 5. Result of solving square SLAE (p = 9; q = 2 500), dimension of matrix А — [ 100×100];
a — two-dimensional slice of the absorption coefficient distribution along x;
b — three-dimensional representation of the distribution of the absorption coefficient along x, y
In addition, Figures 6–9 present supplementary calculation cases for discussing the issue of solvability of indefinite SLAE, as well as the application of the proposed method in the presence of macrodefects of the workpiece.
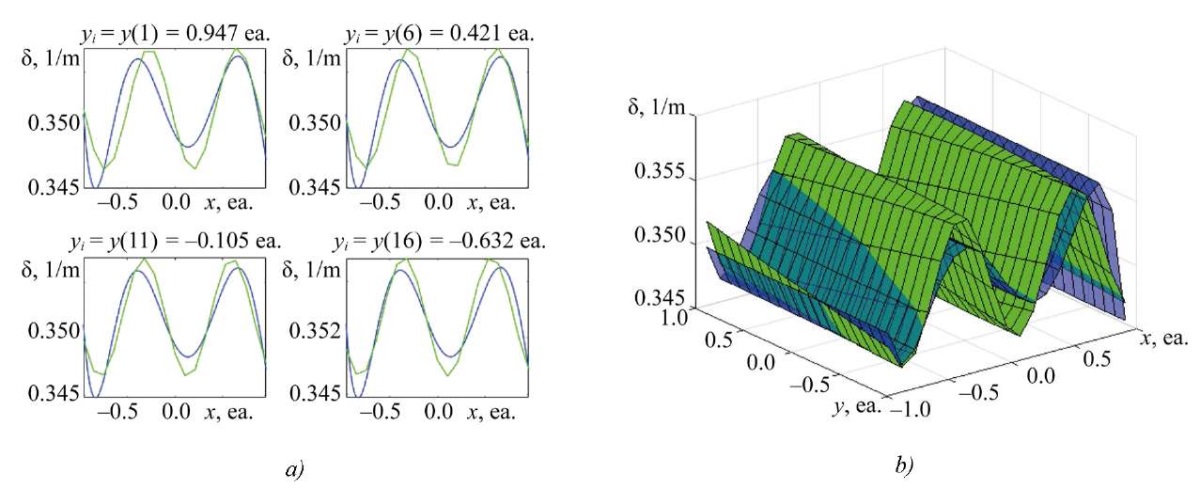
Fig. 6. Result of solving rectangular SLAE (p = 6; q = 361), dimension of matrix А — [ 38×49];
a — two-dimensional slice of the absorption coefficient distribution along x;
b — three-dimensional representation of the distribution of the absorption coefficient along x, y
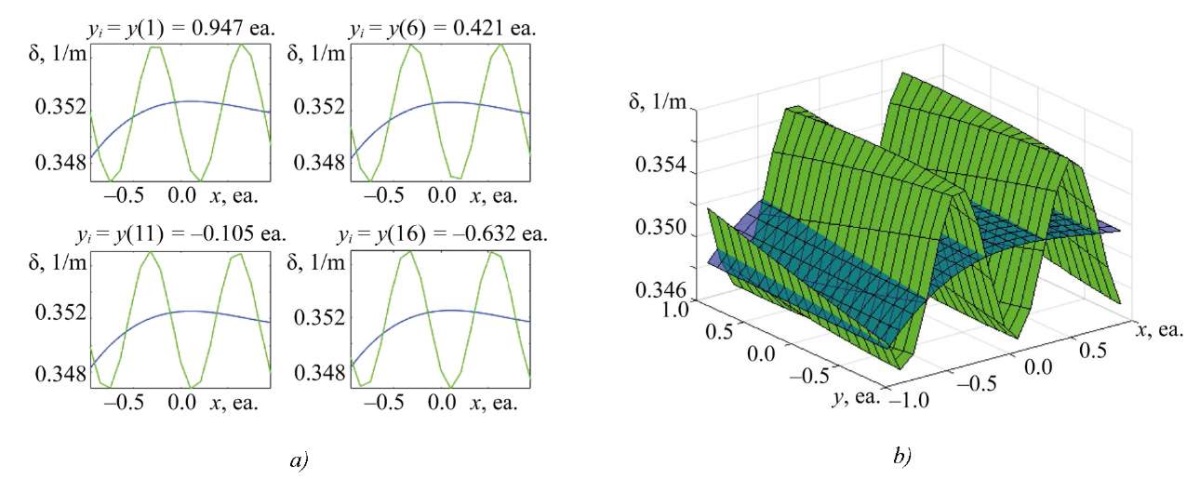
Fig. 7. Result of solving rectangular SLAE (p = 3; q = 361), dimension of matrix А — [ 38×16];
a — two-dimensional slice of the absorption coefficient distribution along x;
b — three-dimensional representation of the distribution of the absorption coefficient along x, y
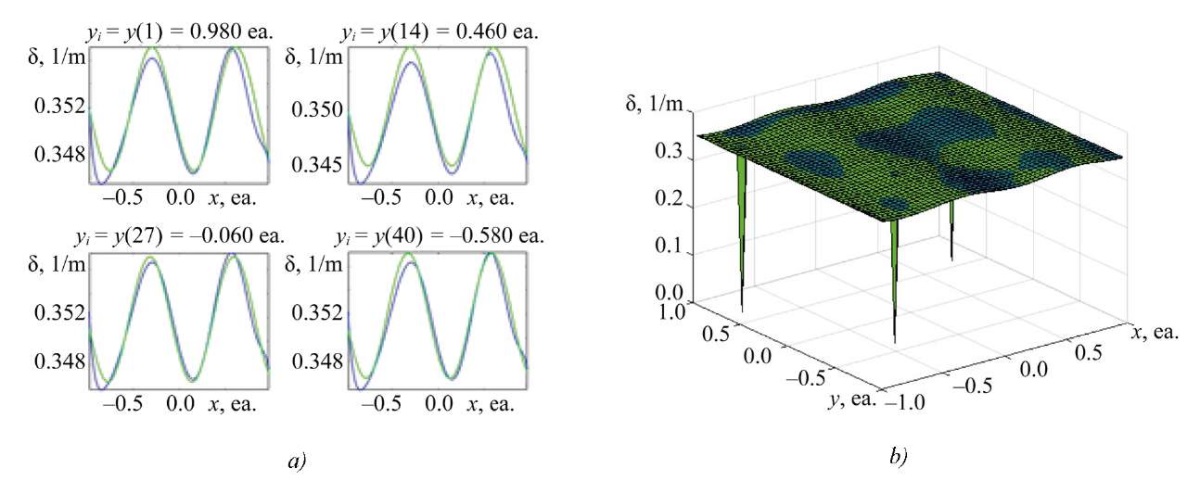
Fig. 8. Result of solving square SLAE (p = 9; q = 2500), dimension of matrix А — [ 100×100];
a — two-dimensional slice of the absorption coefficient distribution along x;
b — three-dimensional representation of the distribution of the absorption coefficient along x, y
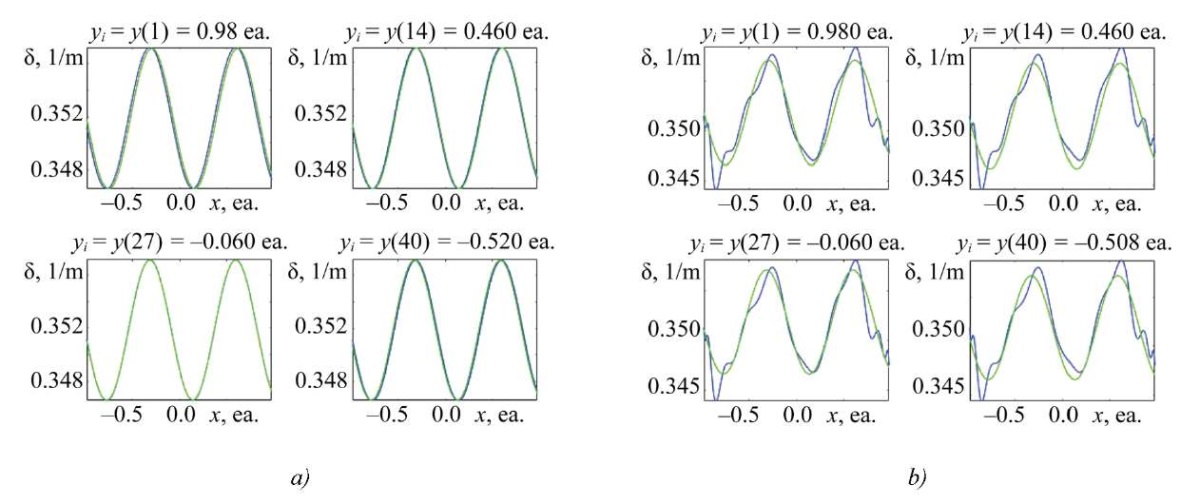
Fig. 9. Result of solving square SLAE (p = 20; q = 2500), dimension of matrix А — [ 100×441];
a — two-dimensional slice of the absorption coefficient distribution along x for a defect-free solution;
b — two-dimensional slice of the absorption coefficient distribution along x for a solution with defects
Figure 10 shows the differences in the distribution of the desired value from the distribution obtained on the basis of the results of solving the SLAE.
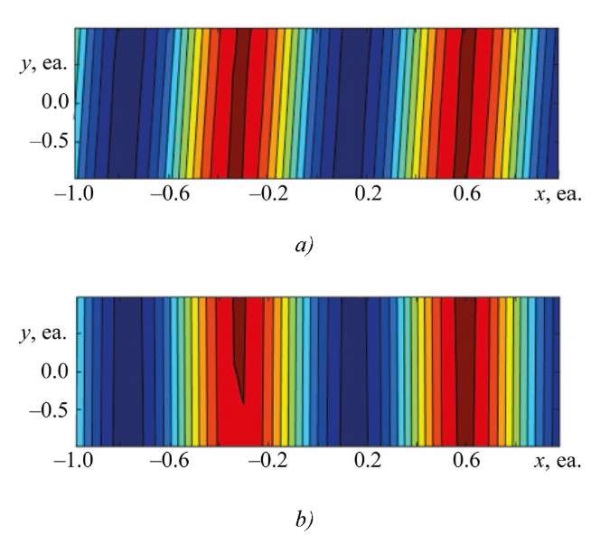
Fig. 10. Result of solving square SLAE (p = 9; q = 2500), dimension of matrix А — [ 100×100];
a — distribution of the desired value according to experimental data;
b — distribution of the desired value based on the results of solving the SLAE
Discussion. Analyzing the data obtained by the proposed identification method (Figs. 2–5), it can be noted that with a sufficient number of measurements (system discretization), it is possible to obtain a solution to an uncertain system with the required accuracy. The results for overdetermined systems turned out to be comparable to the results of underdetermined systems [23], although in some cases, the values were inferior in accuracy. For example, the data presented in Figure 4 demonstrated lower accuracy compared to the results for the matrix dimension A — [ 38×49], obtained by the 6th-degree polynomial (Fig. 6).
In case of significant imbalance between the number of equations and unknowns (for example, for the case of severe overdetermination — Fig. 7), a satisfactory solution could not be found within the presented calculations. Even when obtaining an approximate solution with minimal error, some differences between the reconstructed distribution and the experimental one were still present. This may be due to the features of the proposed method, which requires separate study. For clarity, Figure 10 shows a comparison of the distributions in a color gradient.
At the same time, it was established that the proposed method is sensitive to the presence of macrodefects (pores, bubbles) in the workpiece. Figure 8 shows the result obtained on the basis of the experimental data with three point defects, which correspond to a zero absorption coefficient. When compared to Figure 5 (which presents the results with the highest accuracy), it is evident that the distribution is distorted, and an additional low-frequency harmonic appears on the graph, indicating possible defects. As the degree of the polynomial increases, the solution continues to change, describing a more complex distribution (Fig. 9).
It should be noted that in the case of physical measurements, the presence of macrodefects can significantly affect the results, as this violates the assumption of normal beam incidence on the interface of optically transparent media (pores and bubbles often have curved surfaces). Despite this, the presented method can be improved by taking these aspects into account.
The use of a polynomial increased the stability of the solution to rectangular SLAE. However, it should be remembered that real systems constructed on the basis of experimental data with certain measurement errors create additional complexities that require the use of other methods for calculating SLAE, for example, with solution regularization [24]. Therefore, it is advisable to avoid significant underdetermination and overdetermination of the system. In defense of the method used to solve SLAE, it should be noted that optimization of the relationship between the polynomial degree and the discretization level is required to find an approximate solution with minimal effort. The analysis of the resulting system of equations shows that even for the two-dimensional case, as the element size decreases, the system remains rectangular and becomes increasingly underdetermined — in such systems, the number of equations (u) is less than the number of unknowns (1). Such SLAE have more than one solution and are characterized by a high condition number of the fundamental matrix (matrix A) of the system, which can cause significant difficulties in finding the roots. Taking this into account, in order to control the ratio of the number of equations and unknowns, an assumption was made about the smoothness and continuity of the distribution of the sought quantity over the volume. This assumption is based on the use of the highest quality quartz glass for the manufacture of the HRG resonator, in which the presence of macrodefects3 (bubbles, cavities, cracks) is not allowed [25]. This assumption is consistent with the constitutive relations that are valid both for a constant value of the refractive index and for a slowly varying, continuous function in an optical medium [19].
When discussing practical feasibility, it is necessary to estimate the required measurement error. As noted previously [22], the maximum density spread for quartz glass over the volume of the workpiece (resonator), due to the imperfect geometric parameters of the periodicity cell element, is ±3 % of the nominal value. Due to the proportional dependence of the absorption coefficient on density, the spread of the absorption coefficient over the volume will be similar. In this case, the degree of impact of the spread of the absorption coefficient on the intensity of the light beam passing through the workpiece can be estimated at the level of 0.03%. Consequently, the measurement accuracy must be at least 0.005%. Reaching this level of accuracy requires a certain approach to organizing the field experiment, specifically the use of stable light sources (lasers) with active feedback for thermal and current stabilization, light receivers (photodetectors) with low dark current, and noise suppression from various sources (temperature fluctuations, vibration, electromagnetic interference, etc.). This ultimately allows for an accuracy of approximately 0.001%.
Conclusion. Thus, in this study, we proposed and tested a method for identifying imperfections in the form of inhomogeneity in quartz glass at the preform stage, intended for the fabrication of a resonator, a sensitive element of the HRG. The identification was based on the optical properties of quartz glass, specifically its complex refractive index, whose imaginary part is related to the absorption coefficient and, consequently, to the density of the material. It has been demonstrated that, by conducting a series of experiments measuring the intensity of a light beam transmitted through a workpiece, it is possible to reconstruct the unknown distribution of the absorption coefficient and density over the volume with high accuracy (at least 0.005% of the measured value). Here, the distribution is represented through an orthogonal Legendre polynomial of sufficient degree, maintaining an optimal ratio between the number of polynomial coefficients and the degree of system discretization, determined by the magnitude of the harmonic of the imperfection distribution. It has been established that a ninth-degree polynomial can be used to identify the fourth harmonic of density variation (as a key parameter) with 100 tests. It is important to emphasize that conducting such work at the early stages of production can optimize the shaping process, allowing for the selection of the most effective directions of density distribution throughout the volume to minimize the impact on the splitting of the operating frequency of the resonator.
1. GOST 15130–86. Silica Optical Glass. General Specifications. Electronic Fund of Legal and Regulatory Documents. URL: https://docs.cntd.ru/document/1200023786 (accessed: 31.10.2025).
2. GOST 15130–86. Silica Optical Glass. General Specifications. Electronic Fund of Legal and Regulatory Documents. URL: https://docs.cntd.ru/document/1200023786 (accessed: 10.10.2025).
3. GOST 15130–86. Silica Optical Glass. General Specifications. Electronic Fund of Legal and Regulatory Documents. URL: https://docs.cntd.ru/document/1200023786 (accessed: 31.10.2025).
1. Peshekhonov VG. The Outlook for Gyroscopy. Gyroscopy and Navigation. 2020;11:193–197. https://doi.org/10.1134/S2075108720030062
2. Perelyaev SE. Current State of Wave Solid-State Gyroscopes. Development Prospects in Applied Gyroscopy. In: Proc. XXX Anniversary St. Petersburg International Conference on Integrated Navigation Systems. St. Petersburg: Central Scientific Research Institute “Electropribor”; 2023. p. 431–435. (In Russ.)
3. Volchikhin AI, Volchikhin DM, Malyutin DM, Matveev VV, Raspopov VYa, Telukhin SV, et al. Wave Solid-State Gyroscopes (Analytical Review). News of Tula State University. Technical Sciences. 2017;(9–2):59–78.
4. Shishakov KV, Khvorenkov VV. Solid-State Wave Gyroscopes: Wave Processes, Control, System Integration. Monograph. Izhevsk: Kalashnikov Izhevsk State Technical University; 2018. 264 p. (In Russ.)
5. Maslov AA, Maslov DA, Ninalalov IG, Merkuryev IV. Hemispherical Resonator Gyros (An Overeview of Publications). Gyroscopy and Navigation. 2023;14(1):3–25. https://doi.org/10.1134/S2075108723010054
6. Delhaye F. HRG by Safran: The Game-Changing Technology. In: Proc. IEEE International Symposium on Inertial Sensors and Systems (INERTIAL). New York City: IEEE; 2018. P. 173–177. https://doi.org/10.1109/ISISS.2018.8358163
7. Perelyaev SE. Current State and Scientific and Technical Forecast of the Perspectives of Application of Foreign Hemispherical Resonator Gyros (Analytical Review of Foreign Materials). Navigation News. 2020;(3):14–28.
8. Klimov DM, Zhuravlev VF, Zhbanov YuK. Quartz Hemispherical Resonator (Solid-State Wave Gyroscope). Monograph. Moscow: Kim L.A.; 2017. 193 p. (In Russ.)
9. Lunin BS, Matveev VA, Basarab MA. Wave Solid-State Gyroscope: Theory and Technology. Moscow: Radiotekhnika; 2014. 176 p. (In Russ.)
10. Merkuryev IV, Podalkov VV. Micromechanical and Wave Solid-State Gyroscope Dynamics. Moscow: Fizmatlit; 2009. 226 p. (In Russ.)
11. Lynch DD. Vibratory Gyro Analysis by The Method of Averaging. In: Proc. 2nd St. Petersburg Int. Conf. on Gyroscopic Technology and Navigation. St. Petersburg: Centr. Sci.-Res. Inst. “Elektropribor”; 1995. P. 26–34.
12. Rozelle D. The Hemispherical Resonator Gyro: From Wineglass to the Planets. Advances in the Astronautical Sciences. 2009;134:1157–1178.
13. Polunin PM, Shaw SW. Self-Induced Parametric Amplification in Ring Resonating Gyroscopes. International Journal of Non-Linear Mechanics. 2017;94:300–308. https://doi.org/10.1016/j.ijnonlinmec.2017.01.011
14. Zotov SA, Trusov AA, Shkel AM. Three-Dimensional Spherical Shell Resonator Gyroscope Fabricated Using Wafer-Scale Glassblowing. Journal of Microelectromechanical Systems. 2012;21(3):509–510. https://doi.org/10.1109/JMEMS.2012.2189364
15. Saypulaev MR, Merkuryev IV, Solovyev AV, Tarasov AN. Study on Free Oscillations of a Micromechanical Gyroscope taking into Account the Nonorthogonality of the Torsion Axes. Advanced Engineering Research (Rostov-on-Don). 2021;21(3):231–238. https://doi.org/10.23947/2687-1653-2021-21-3-231-238
16. El-Sheimy N, Youssef A. Inertial Sensors Technologies for Navigation Applications: State of the Art and Future Trends. Satellite Navigation. 2020;1(2):1–22. https://doi.org/10.1186/s43020-019-0001-5
17. Saleh B, Teich M. Optics and Photonics: Principles and Applications, 2nd ed. In 2 vol. Vol. 2. Dolgoprudnyi: Intellekt; 2012. 760 p. (In Russ.)
18. Born M, Wolf E. Principles of Optics: 60th Anniversary Edition, Cambridge: Cambridge University Press; 2019. 992 p.
19. Akhmanov SA, Nikitin SYu. Physical Optics. 2nd ed. Moscow: Nauka; 2004. 654 p. (In Russ.)
20. Korn GA, Korn Th. Mathematical Handbook for Scientists and Engineers: Definitions. Theorems. Formulas, 6th ed. St. Petersburg: Lan'; 2003. 831 p. (In Russ.)
21. Demmel JW. Computational Linear Algebra. Theory and Applications. Moscow: Mir; 2001. 430 p. (In Russ.)
22. Shevchenko SA, Melnikov BE. Fused Quartz Imperfections and Their Influence on the CVG Resonator Dynamics. Izvestiya of Saratov University. Mathematics. Mechanics. Informatics. 2024;24(4):611–618. https://doi.org/10.18500/1816-9791-2024-24-4-611-618
23. Björck Å. Numerical Methods in Matrix Computations. New York, NY: Springer; 2015. 800 p.
24. Buccini A, Gazzola S, Onisk L, Pasha M, Reichel L. Projected Iterated Tikhonov in General Form with Adaptive Choice of the Regularization Parameter. Numerical Algorithms. 2025;100:1617–1637. https://doi.org/10.1007/s11075-025-02072-2
25. Bubis Iya, Weidenbach VA, Dukhoped II, Kuznetsova SM (ed), Okatova MA (ed). Handbook of an Optical Technologist. Leningrad: Mashinostroenie; 2009. 244 p. (In Russ.).
Sergei A. Shevchenko, Engineer of the Higher School of Mechanics and Control Processes, Institute of Physics and Mechanics
29 B, Polytechnicheskaya Str., St. Petersburg, 195251
Scopus Author ID: 57194325442
Ivan A. Popov, Senior Lecturer at the Advanced Engineering Technology School, Advanced Engineering School “Digital Engineering
29 B, Polytechnicheskaya Str., St. Petersburg, 195251
Scopus Author ID: 57198043927
Boris E. Melnikov, Dr.Sci (Eng.), Professor of the Higher School of Mechanics and Control Processes, Institute of Physics and Mechanics
29 B, Polytechnicheskaya Str., St. Petersburg, 195251
Scopus Author ID: 6701751705
A method for early control of resonator density nonuniformity is developed. The method relates the optical properties of quartz glass to its density distribution. Density is reconstructed from measurements of the light beam passing through a workpiece. The density distribution with a deviation of no more than five percent is obtained. The method is sensitive to volume defects such as pores and bubbles. The results are applicable to optimizing the production of high-precision attitude control systems.
Shevchenko S.A., Popov I.A., Melnikov B.E. Optical Method for Material Imperfections Identification in the Resonator Workpiece of Hemispherical Vibratory Gyroscope. Advanced Engineering Research (Rostov-on-Don). 2025;25(4):311-323. https://doi.org/10.23947/2687-1653-2025-25-4-2202. EDN: TVJRQI


Advanced Engineering Research (Rostov-on-Don)
ISSN 2687-1653 (Online)
Contact with: Publisher / Editorial Office of the Journal
Publisher: Don State Technical University - DSTU, Rostov-on-Don, Russia - https://donstu.ru/en/
Editor-in-Chief: Alexey N. Beskopylny, Dr.Sci. (Eng.), Professor, Vice-Rector, Don State Technical University (Rostov-on-Don, Russia)
Don State Technical University
1, Gagarin Sq., Rostov-on-Don, 344003, Russia
tel.: +7 (863) 2738-372, e-mail: vestnik@donstu.ru
16+
Processing of personal data