Contents
Scroll to:
https://doi.org/10.23947/2687-1653-2022-22-3-224-231
Scroll to:
Introduction. One of the commonly used methods for assessing the dynamic characteristics of a material is the Taylor test, which establishes the relationship between the dynamic yield strength of a cylindrical sample material and its length after hitting a non-deformable barrier. The purpose of this work was to study the microhardness and determine the dynamic yield strength of copper samples for various impact velocities in the Taylor test.
Materials and Methods. Experiments were carried out with cylindrical copper (M1) samples. The throwing conditions were selected on the ballistic stand, which provided the speed of the sample in the range of 150–450 m/s at the exit from the barrel. After the impact, the microhardness of the samples in the section plane was measured. The calculation of the dynamic yield strength was carried out according to the classical Taylor formula.
Results. Experimental data are presented for cylindrical copper samples upon impact on a rigid wall with velocities in the range of 162–416 m/s, including configurations and sizes of images before and after impact. Microhardness distributions in the axial section of the samples were obtained. For each sample, the dependences of the averaged values of microhardness were constructed, which made it possible to identify four areas of deformation of the samples (the area of elastic deformations, plastic deformations, intense plastic deformations, the area of the material undergoing destruction) and determine their sizes. The dynamic yield strength of copper in the studied range of impact velocities was calculated.
Discussion and Conclusions. The values of microhardness in the entire considered region and for all studied impact velocities exceeded the initial value. There was a significant increase in the value of the dynamic yield strength compared to its static value. The correlation of the maximum averaged values of microhardness and dynamic yield strength, which grew with increasing impact velocity, was identified.
Pakhnutova N.V., Boyangin E.N., Shkoda O.A., Zelepugin S.A. Microhardness and Dynamic Yield Strength of Copper Samples upon Impact on a Rigid Wall. Advanced Engineering Research (Rostov-on-Don). 2022;22(3):224-231. https://doi.org/10.23947/2687-1653-2022-22-3-224-231
Introduction. The development in the scientific and technical fields related to the dynamic loading of bodies depends largely on the creation of new materials with specified properties. This was the impetus for active experimental, analytical and numerical studies related to the dynamic loading of deformable solids [1–4].
One of the commonly used methods for assessing the dynamic characteristics of a material is the Taylor test (method, task). The Taylor method establishes the relationship of the dynamic yield strength of the material of a cylindrical sample and its length after impact on a non-deformable barrier (rigid wall). This approach is often used to determine the dynamic yield strength of new materials [5–8], as well as to choose the determining ratios and select constants under the numerical modeling [9–14].
Light-gas guns (LGG) are used to accelerate bodies with a given shape. These installations make it possible to obtain a throwing speed of up to 7–9 km/s, in some experiments — up to 11 km/s, thanks to which they have been widely used in gas dynamics, ballistics, materials science, etc. The Research Institute of Applied Mathematics and Mechanics, Tomsk State University, has developed a single-stage light-gas gun [15] in which the sample is accelerated by compressed gas (helium) supplied from a balloon. It was used to conduct experiments by the Taylor method presented in this paper.
This paper is aimed at studying the microhardness and determining the dynamic yield strength of copper samples for various impact velocities in the Taylor test.
Materials and Methods. The experiment was carried out with cylindrical copper (M1) samples with a length of 34.5 mm, a diameter of 7.8 mm, and a weight of about 15 g. The composition of the sample material is indicated in Table 1.
Table 1
Composition of copper (М1)

The throwing conditions were selected on the ballistic stand, which provided the speed of the sample in the range of 150–450 m/s at the exit from the barrel. The selection of conditions was required, since samples of significantly smaller mass were usually used for such experiments, which were thrown at a much higher initial velocity. By adapting the initial conditions and equipment, it was possible to provide stable throwing of the copper cylinder at a given speed. After the experiment, the samples were cut into two equal parts along the axis of symmetry using DK7732 CNC machine for electroerosion cutting.
Microhardness was measured in the section plane along the axial line of the samples on a PTM–3 hardness tester according to GOST 9650–76 by indentation of diamond tips. The measurement error of this device was 2 %. The microhardness values were also calculated according to GOST 9650–76.
The calculation of the dynamic yield strength σ was carried out according to the classical Taylor formula:
where ρ — density of the material; υ — impact velocity; L0 — initial length; L — final length after impact; Le — length of the elastic part of the sample. In this formula, the key indicators were the length of the elastic part of the sample and the final length of the cylinder after impact.
Research Results. Microhardness. Figure 1 shows cross sections of copper samples after impact at different initial velocities. For all samples, there was a region of elastic deformation with a finite diameter equal to the initial one, including for a speed of 416 m/s. The elastic region turned into a plastic one, which was accompanied by deformation, including in the radial direction, and, accordingly, an increase in the final diameter. Closer to the contact surface, a zone of intense plastic deformations that passed into the zone of destruction of the cylinder material was observed. There was also a slight asymmetry of the deformation of the samples due to the characteristic properties of throwing, which might create some difficulties for direct comparison of the results of experiments and numerical modeling when using the axis of symmetry or the plane of symmetry in the formulation of the problem.
Fig. 1. Cross sections of copper samples after impact at different initial velocities:
a — 162 m/s; b — 225 m/s; c — 316 m/s; d — 416 m
Fig. 2. Distribution of values along the centerline of samples for different impact velocities
(1— 162 m/s, 2— 225 m/s, 3— 316 m/s, 4— 416 m/s):
a — microhardness; b — calculated averaged distribution of microhardness
In the initial state, the measured average microhardness was 1,150 ± 100 MPa. Such a spread of values, apparently, occurred due to the structural features of the material and the presence of inhomogeneities in the structure. Figure 2 a shows the distribution of microhardness values along the centerline of the sample for different impact velocities, and Figure 2 b presents the results of averaging the obtained values.
Through comparing the average values of microhardness to the value in the nondeformable sample (1,150 MPa), we obtained that microhardness in the entire region under consideration exceeded the initial value. Several deformation zones can be distinguished. This is the rear region of the sample, where there is a slight increase in microhardness to values of 1,250–1,350 MPa, apparently associated with the effect of gas pressure during throwing. In the middle part, microhardness approaches the indicators of undeformed samples. Further, closer to the contact boundary, microhardness starts to grow to values of 1,400–1,600 MPa with an exit to the inflection point, after which there is a sharp increase in microhardness to 1,800–2,700 MPa.
The maximum microhardness is observed at an impact velocity equal to 316 m/s, while at higher speeds, a sharp decrease in the microhardness value is observed in Figure 2. The drop in microhardness in the sample for the impact velocity of 416 m/s is due to its destruction in the impact area and the loss of part of the cylinder material in the form of fragments.
Let us take a closer look at a sample with an impact velocity of 316 m/s. For this sample, two series of measurements were made along two lines, which are notionally named C and C1. The location of these lines was chosen from the following considerations. Line C was located along the axis of symmetry, and line C1 passed through the middle of the radius of the sample section. During the microhardness measurements, over 100 measurements were made along each line. This array of microhardness values was averaged, the result of averaging is shown in Figure 3.
Fig. 3. Averaged distribution of microhardness of a copper sample
at an impact velocity of 316 m/s along the lines: a — C; b — C1
Figure 3 shows that both curves have a nonlinear character, and the distribution of microhardness in both cases is qualitatively similar and quantitatively close. Such data make it possible to identify areas of deformation of samples and determine their dimensions.
Areas of deformation of cylindrical samples. It is proposed to consider the scheme of deformation of a cylindrical sample, shown in Figure 4 and including four areas, whose size is determined based on the analysis of the distribution of microhardness.
Zone 1 corresponds to the area of elastic deformations; 2 — plastic; 3 — intense plastic deformations; 4 — the area of the material undergoing destruction. Table 1 shows the sizes of these sample areas depending on the impact velocity, where υ — impact velocity; L — final length after impact; Le — length of the elastic deformation zone; Lp — length of the plastic deformation zone; Lipf — length of the zone of intense plastic deformations; Lf — length of the fracture zone; D1 — diameter of the rear end of the cylinder; D2 — diameter of the contact boundary.
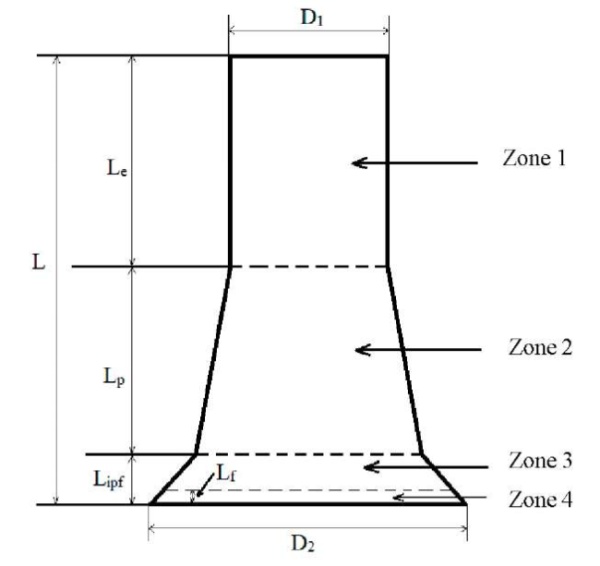
Fig. 4. Scheme of sample deformation after collision with a rigid wall
Table 2
Geometric dimensions of the deformation areas of the samples
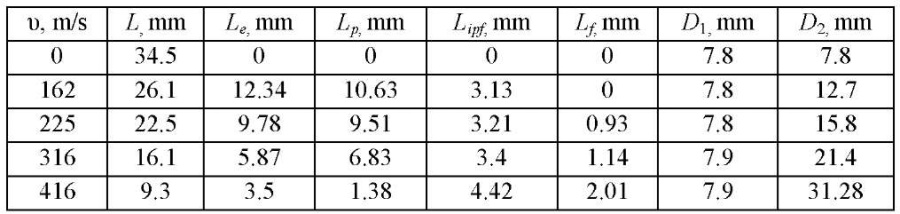
The data given in Table 2 show that the sample had no material destruction zone at an impact velocity of 162 m/s. The resulting sample is an example of the classical Taylor test, which can later be used to create an adequate numerical model of the impact of a cylindrical sample on a rigid barrier, and the selection of constants of the material models. Samples at speeds of 225 m/s and 316 m/s exhibited all four zones, but compared to the sample at a speed of impact of 416 m/s, the destruction zone was small. A cylinder with an impact velocity of 416 m/s had practically no plastic deformation zone after the test. At a given impact velocity, the elastic deformation zone quickly turned into a zone of intense plastic deformations combined with a fracture zone.
Dynamic yield strength. The results of the calculation of the dynamic yield strength σ are presented in Figure 5 a. The speed value of 416 m/s was not taken into account, since in this case, the destruction of the cylinder was significant, which did not allow applying this calculation method. The static yield strength of M1 copper was 0.1 HPa. There was a significant increase in the value of the dynamic yield strength compared to its static value; there was also an increase in the dynamic yield strength with an increase in the impact velocity.
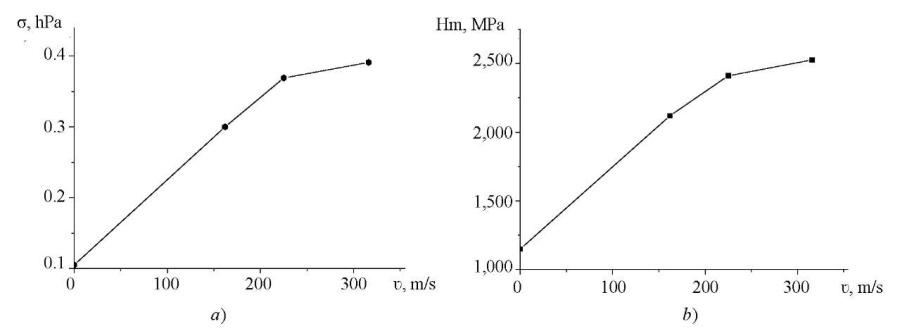
Fig. 5. Dependences on the impact velocity:
a — dynamic yield strength;
b — maximum microhardness
Figure 5 b shows the dependence of the maximum microhardness of the samples on the impact velocity. The graphs in Figure 5 a and 5 b are qualitatively similar, which implies a correlation of the dynamic yield strength and maximum microhardness, and the possibility of their mutual recalculation.
Discussion and Conclusions. The results of Taylor test experiments for cylindrical copper samples in the range of impact velocities of 162–416 m/s are presented. The data obtained has shown that after the impact of the cylinder on the rigid wall, the microhardness in the entire sample exceeded the initial value of 1,150 MPa, and in the impact area there was a significant increase in microhardness up to 1,800–2,700 MPa. The separation of the deformed cylinder into four areas was proposed: elastic deformation, plastic, intensive plastic deformation and destruction. Estimates of the sizes of these areas for the studied impact velocities were given. According to the classical Taylor formula, the dynamic yield strength was calculated, which significantly exceeded the static yield strength and grew with increasing impact velocity. The dependences of the dynamic yield strength and the maximum averaged value of microhardness on the impact velocity of the sample on a nondeformable barrier were shown. The correlation of the maximum averaged values of microhardness and dynamic yield strength, which increased with growing impact velocity, was specified. The presented data can be of value for assessing the adequacy of the physicomathematical model used for numerical calculation of problems of high-speed deformation of metals and alloys.
1. Лапшин, В. Л. Алгоритм управления упруго-вязко-пластичной моделью для исследования процессов ударного взаимодействия тел / В. Л. Лапшин, Е. В. Зеньков // Advanced Engineering Research. — 2021. — Т. 21. — С. 191−199. https://doi.org/10.23947/2687-1653-2021-21-2-191-199
2. Dynamic Hardening of AISI 304 Steel at a Wide Range of Strain Rates and Its Application to Shot Peening Simulation / Sungbo Lee, Kwanghyun Yu, Hoon Huh [et al.] // Metals. — 2022. — Vol. 12. — P. 403. https://doi.org/10.3390/met12030403
3. Taylor Impact Tests with Copper Cylinders: Experiments, Microstructural Analysis and 3D SPH Modeling with Dislocation Plasticity and MD-Informed Artificial Neural Network as Equation of State / E. S. Rodionov, V. G. Lupanov, N. A. Gracheva [et al.] // Metals. — 2022. — Vol. 12. — P. 264. https://doi.org/10.3390/met12020264
4. Simple Shear Behavior of 2024-T351 Aluminum Alloy over a Wide Range of Strain Rates and Temperatures: Experiments and Constitutive Modeling / Bin Jia, Alexis Rusinek, Xinke Xiao, Paul Wood // International Journal of Impact Engineering. — 2021. — Vol. 156 — Art. 103972. https://doi.org/10.1016/J.IJIMPENG.2021.103972
5. Chong Gao. Instrumented Taylor Impact Test for Measuring Stress-Strain Curve through Single Trial / Chong Gao, Takeshi Iwamoto // International Journal of Impact Engineering. — 2021. — Vol. 157. — Art. 103980. https://doi.org/10.1016/J.IJIMPENG.2021.103980
6. Characteristics in Taylor Impact Test on Projectiles with Various Nose Shapes / Jun-Cheng Li, Gang Chen, Feng-Lei Huang, Yong-Gang Lu // Metals. — 2021. — Vol. 11. — P. 713. https://doi.org/10.3390/met11050713
7. Investigation on the Application of Taylor Impact Test to High-G Loading / Li Juncheng, Chen Gang, Lu Yonggang, Huang Fenglei // Frontiers in Materials. — 2021. — Vol. 8. — P. 717122. 10.3389/fmats.2021.717122
8. Sen, S. Taylor Impact Test Revisited: Determination of Plasticity Parameters for Metals at High Strain Rate / Subhajit Sen, Biswanath Banerjee, Amit Shaw // International Journal of Solids and Structures. — 2020. — Vol. 193 –194. — P. 357–374. https://doi.org/10.1016/j.ijsolstr.2020.02.020
9. Киселев, А. Б. Особенности процесса соударения упругопластического цилиндра с недеформируемой преградой / А. Б. Киселев, А. А. Серёжкин // Прикладная математика и механика. — 2015. — Т. 79. — С. 571–583. https://doi.org/10.1016/j.jappmathmech.2016.01.011
10. Баяндин, Ю. В. Верификация широкодиапазонных определяющих соотношений для упруговязкопластических материалов с использованием теста Тейлора-Гопкинсона / Ю. В. Баяндин, Д. А. Билалов, С. В. Уваров // Вычислительная механика сплошных сред. — 2020. — Т. 13. — С. 449–458.
11. Моделирование процесса динамического канально-углового прессования медных образцов с учетом экспериментальных условий нагружения / Д. В. Янов, А. С. Бодров, Н. В. Пахнутова, С. А. Зелепугин // Вестник Томского государственного университета. Математика и механика. — 2019. — № 60. — С. 141–151. https://doi.org/10.17223/19988621/60/11
12. Численное моделирование процессов динамического канально-углового прессования титановых образцов / А. С. Бодров, Н. В. Олимпиева, А. С. Зелепугин, С. А. Зелепугин // Вестник Томского государственного университета. Математика и механика. — 2015. — № 5 (37). — С. 56–63. http://dx.doi.org/10.17223/19988621/37/5
13. Трехмерное моделирование процессов пластического деформирования металлических образцов при динамическом канально-угловом прессовании / С. А. Зелепугин, А. С. Зелепугин, А. С. Бодров, Н. В. Олимпиева // Известия высших учебных заведений. Физика. — 2013. — Т. 56. — С. 50–52.
14. Armstrong, R. W. Constitutive Relations for Slip and Twinning in High Rate Deformations: A Review and Update / R. W. Armstrong // Journal of Applied Physics. — 2021. — Vol. 130. — Р. 245103. https://doi.org/10.1063/5.0075916
15. Khristenko, Y. F. New Light-Gas Guns for the High-Velocity Throwing of Mechanical Particles / Y. F. Khristenko, S. A. Zelepugin, A. V. Gerasimov // ARPN Journal of Engineering and Applied Sciences. — 2017. — Vol. 12. — P. 6606–6610.
36, Lenin Avenue, Tomsk;
RAS, 10/4, Akademichesky Av., Tomsk
RAS, 10/4, Akademichesky Av., Tomsk
RAS, 10/4, Akademichesky Av., Tomsk
36, Lenin Avenue, Tomsk;
RAS, 10/4, Akademichesky Av., Tomsk
Pakhnutova N.V., Boyangin E.N., Shkoda O.A., Zelepugin S.A. Microhardness and Dynamic Yield Strength of Copper Samples upon Impact on a Rigid Wall. Advanced Engineering Research (Rostov-on-Don). 2022;22(3):224-231. https://doi.org/10.23947/2687-1653-2022-22-3-224-231


Advanced Engineering Research (Rostov-on-Don)
ISSN 2687-1653 (Online)
Contact with: Publisher / Editorial Office of the Journal
Publisher: Don State Technical University - DSTU, Rostov-on-Don, Russia - https://donstu.ru/en/
Editor-in-Chief: Alexey N. Beskopylny, Dr.Sci. (Eng.), Professor, Vice-Rector, Don State Technical University (Rostov-on-Don, Russia)
Don State Technical University
1, Gagarin Sq., Rostov-on-Don, 344003, Russia
tel.: +7 (863) 2738-372, e-mail: vestnik@donstu.ru
16+
Processing of personal data