Contents
Scroll to:
https://doi.org/10.23947/2687-1653-2023-23-1-66-75
Scroll to:
Introduction. Electronic devices capable of collecting individual telemetry data have opened up prospects for preclinical detection of COVID-19 signs. Known solutions involve the analysis of information that is difficult to obtain at the moment. We are talking, specifically, about the blood condition or a PCR test. This significantly limits the possibility of integrating algorithms with wrist gadgets. At the same time, the cardiovascular system as an object of observation is quite informative, the data collection is well developed. The article describes the problem of detecting covid anomalies in rhythm strips. The work aims at creating a mathematical model based on machine learning algorithms to automate the process of detecting covid abnormalities in the heart rhythm. The possibility of integrating the results obtained with fitness bracelets and smart watches is shown.
Materials and Methods. The work involved an open technology stack: Python, Scikit-learn, Lightgbm. When assessing the quality of models for binary classification, metric F1 was used. 229 cardiac rhythm strips (сardiointervalographies) of patients with COVID-19 were studied. The presence or absence of signs of an anomaly was determined taking into account the time of the rhythm strip and the intervals between heartbeats. Deviations that could indicate infection were shown graphically. Based on the exploratory analysis results, a list of signs indicating an anomaly was made.
Results. As a result of the work done, a mathematical model was obtained that detected heart rate abnormalities specific to COVID-19 with an accuracy of 83 %. The basic features determining the predictive ability of the model were identified and ranked. They included the current value of the interval between heartbeats, the derivatives at the subsequent and previous points of measuring the duration of the heartbeat, the first derivative at the current point, and the deviation of the current value of the duration of the RR-interval from the median. The first indicator in this list was recognized as the most significant, the last — the least. For machine learning purposes, the potential of five algorithms was evaluated: IsolationForest, LGBMClassifier, RandomForestClassifier, ExtraTreesClassifier, SGDOneClassSVM. The normal and abnormal results of observations in isolation trees were visualized. A parameter was set that corresponded to the probability of regular observation outside the norm, and its value was selected — 0.11. Taking into account this indicator, a graph was constructed for the SGDOneClassSVM model. Based on the data set, using the cross-validation technique, the quality metric was calculated. The case in hand was a rhythm strip with a time series of observations taken in one continuous time interval from one person. A step-by-step process of obtaining averaged metric values for each model was described. In comparison, the highest indicator was recorded for the LGBMClassifier model, the lowest — for SGDOneClassSVM and IsolationForest.
Discussion and Conclusions. The resulting mathematical model takes up little space in the memory of a mobile device, i.e., it does not impose significant requirements on computing resources. The solution has an acceptable detection quality for preclinical screening of COVID-19-related cardiovascular disorders. The algorithm detects anomalies in 83 % of cases. Four minutes is enough to record a rhythm strip. The proposed scenario for using an integrated solution is concise and easy to implement. Widespread use of the development can contribute to the detection of COVID-19 at an early stage.
Mezhov M.S., Kozitsin V.O., Katser I.D. Machine Learning Model for Early Detection of COVID-19 by Heart Rhythm Abnormalities. Advanced Engineering Research (Rostov-on-Don). 2023;23(1):66-75. https://doi.org/10.23947/2687-1653-2023-23-1-66-75
Introduction. Investigation of the impact of COVID-19 on humans remains a challenge. Thus, in 2021-2022, more than 16,000 scientific papers were published on this topic. One of the main causes of death of covid-positive patients was complications in the cardiovascular system (hereinafter referred to as CVS) caused by exposure to coronavirus [1]. Two methods are mainly used for preclinical diagnosis of COVID-19: biochemical method based on polymerase chain reaction (PCR test) and blood analysis. Contacts with medical staff needed in this case (including visits to medical institutions) complicate regular operational control and increase the burden on the healthcare system. Thus, it seems relevant to use modern technologies of preclinical control of CVS for early detection of COVID-19 signs.
Wearable electronic devices can provide regular monitoring. The most common of them are fitness bracelets and smart watches with built-in heart rate sensors and the ability to perform measurements with high discreteness [2]. This approach opens up opportunities for analyzing data flows based on machine learning1 [3].
The presented study aims at creating a trainable model capable of detecting covid anomalies based only on data on heart rhythm. A number of papers [4–6] consider similar problems, but the solutions are based on additional information about the state of the blood and other characteristics2. This significantly limits the possibilities of their integration with wearable devices, because at the moment, it is impossible to enter the results of a blood test or a smear for a PCR test into the model. The novelty of the proposed solution is in the fact that only heart rate data is used, which can be taken with a high frequency in a way convenient for a person and interpret the indicators in real time.
Data characteristics. 229 impersonal rhythm strips (сardiointervalographies) of patients with COVID-19 were used in the research. The information was obtained in 2021 as part of the open All-Russian competition “Digital Breakthrough” for professionals in the digital economy. A data fragment is presented in Table 1.
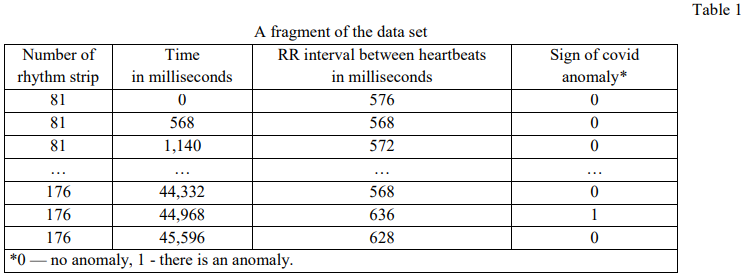
Figure 1 shows the relationship of the rhythm strip (RR interval) and the electrocardiogram of the heart (ECG).
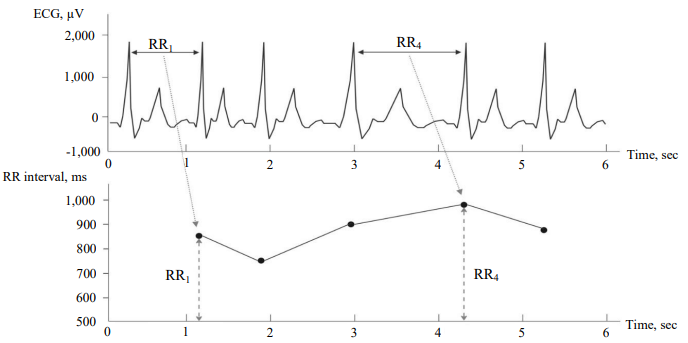
Fig. 1. Comparison of electrocardiogram and heart rhythm strip: horizontal axis shows the time in seconds, vertical axis for the ECG — microvolts
In all rhythm strips from this set, there are marked abnormal areas. In Figure 2, abnormal areas are highlighted with a red dotted line. The 𝑥-axis shows the duration of one measurement of the rhythm strip in milliseconds, the 𝑦-axis — the interval between adjacent heartbeats in milliseconds.
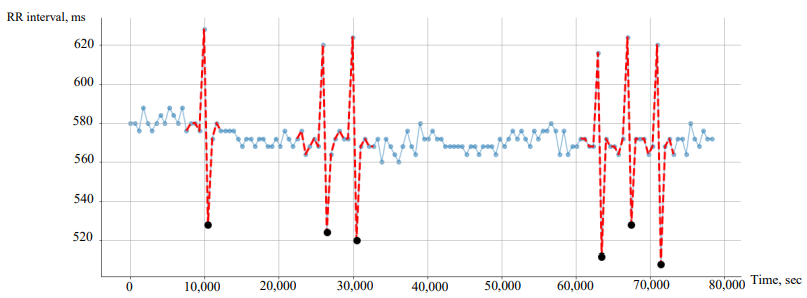
Fig. 2. Chart of rhythm strip No. 69: abnormal areas are highlighted with red dotted lines, abnormal points — with black bullet points
Each rhythm strip is presented by its own identifier. The duration of rhythm strips in the studied data set is different: 4 minutes on average, 31 minutes maximum. Each measurement inside one rhythm strip has a timestamp in milliseconds from the start of recording. The duration of the RR interval is also presented in milliseconds. Each specific value in the rhythm strip allows us to talk about the signs of an anomaly (0 — no, 1 — there is). 2.53 % of observations are marked with number 1. Thus, the data set has a strong class imbalance, which is typical for anomaly detection tasks.
In the data markup, there are various approaches to the allocation of abnormal areas. Groups of points in the vicinity of a characteristic peak and fall in the duration of the heart rhythm were distinguished as abnormal: 3rd, 4th, 6th measurements (Fig. 2). Not always the number of points in the neighborhood is marked the same — there may be a different number of abnormal points to the left and right of the peak. Moreover, rhythm strips with noisy indications were detected. This was the case when the connection with the gadget was lost, and measurements were taken when installing or removing the device. Sixteen rhythm strips with incorrect data had to be excluded from consideration, and the markup was redone:
Feature extraction. In its pure form, only one signal was presented — the value of intervals between heartbeats. Therefore, to refine the model, additional features were prepared based on the available signal: deviation from the median value and derivatives in neighboring rhythm measurements. This list of features was selected after an exploratory data analysis and visual identification of the pattern in places corresponding to abnormal areas. In Figure 2, they were marked with a red dotted line.
Metric for evaluating the quality of anomaly detection. To assess the quality of the model in the binary classification problem, due to the imbalance of classes, metric 𝐹1 [7] (1) was used. It provided evaluating how well a constructed model detected a rare class. In that context, a rare class referred to abnormal heartbeats in duration — heartbeats with an abnormal rhythm:
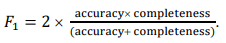 (1)
(1)
Here:
Machine learning algorithms. As part of the study, five machine learning algorithms described below were applied.
1. IsolationForest — an algorithm with uncontrolled self-learning based on extremely randomized decision trees [8].
2. Light Gradient Boosting Machine Classifier (LGBMClassifier) — an algorithm for gradient boosting over decision trees [9]. To increase the operation speed, two techniques were used: Gradient-based One-Side Sampling and Exclusive Feature Bundling3.
3. RandomForestClassifier is based on decision trees and implements multiple selection of a random subset of features. They are used to build simpler estimators — decision trees. The results are aggregated to obtain a final prediction [10].
4. ExtraTreesClassifier is similar to RandomForestClassifier, however, it additionally implements a random selection of the boundary along which nodes branch in decision trees [11].
5. SGDOneClassSVM4 — a linear version of One-Class Support Vector Machine using Stochastic Gradient Descent.
IsolationForest and SGDOneClassSVM were chosen due to their wide use in anomaly detection tasks [12, 13]. LGBMClassifier, RandomForestClassifier and ExtraTreesClassifier perform well enough in different tasks, therefore, they were also used to compare the results [12, 13].
The specific feature of the IsolationForest and SGDOneClassSVM algorithms is that they do not require a clear marking of anomalous observations at the input, while it is mandatory for the rest of the algorithms used in the study.
IsolationForest is based on the assumption that when constructing isolating trees, abnormal observations can be isolated (separated) in fewer operations than normal observation instances. For each observation, the algorithm calculates the anomaly score by the formula:
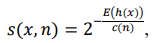 (2)
(2)
where ℎ(𝑥) — number of edges up to instance 𝑥 in each isolating decision tree; 𝐸(ℎ(𝑥)) — average value ℎ(𝑥) on the entire set of isolating trees; с(𝑛) — normalizing constant for a data set of size 𝑛 (3).
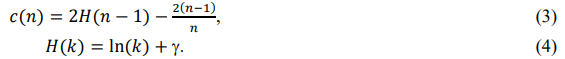
In equation (4) y — Euler’s constant equal to 0.57721…
If observation 𝑥 has an anomaly estimation value 𝑠, close to 1, then it is considered anomalous. If 𝑠 is close to 0.5, then the observation has no obvious signs of an anomaly. If 𝑠 is close to 0, then the observation can be considered normal (Fig. 3).
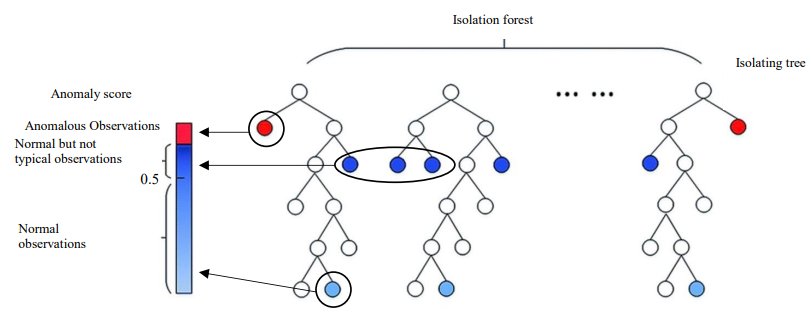
Fig. 3. Normal and anomalous observations in isolating trees (the authors’ figure)
SGDOneClassSVM is based on the opposite approach to IsolationForest. The algorithm determines the boundaries of normal observations and compares all new observations to the boundaries of this norm to identify an anomaly.
Feature Significance. An assessment of the degree of impact of features on the predictive ability of the model is shown in Figure 4.
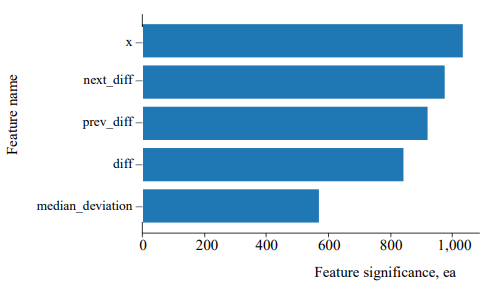
Fig. 4. Feature significance diagram: х — current value of the interval; next_diff — derivative at the next point of measuring the heartbeat duration; prev_diff — derivative at the previous point of measuring the heartbeat duration; diff — the first derivative at the current point; median_deviation — deviation of the current value of the RR interval duration from the median
To calculate the numerical significance estimate, a mechanism built into LGBMClassifier was used, which returns an array of numerical estimates for each feature via the feature_importances_ property of the trained model. Significance in models based on gradient boosting over decision trees is usually calculated on the Gini-impurity Index5 [14], used in the process of determining the branching points when training the model:
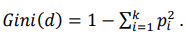 (5)
(5)
Here, 𝑑 — a set of observations that match the conditions at the considered branching point, 𝑑 ∈ 𝐷; k — number of classes presented in the entire training dataset D; 𝑝𝑖 — probability of observations belonging to class i at the considered branching point of the decision tree.
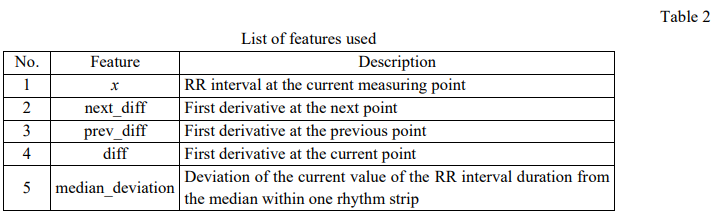
The following features were the most significant: the current value of interval (х), the derivative at the next (next_diff) and previous (prev_diff) points of measuring the heartbeat duration (Fig. 4). A complete list of the features used is given in Table 2.
Comparison of models. For effectiveness of SGDOneClassSVMmodel, it is important to select parameter nu, which corresponds to the probability of detecting regular observation outside the norm. In other words, nu determines the upper bound of the error rate when training the model, and the lower bound of the support vector fraction6. To select nu taking into account the available data nature, the quality metric was additionally assessed at different values of the specified parameter (Fig. 5). As a result, nu equal to 0.11 was selected.
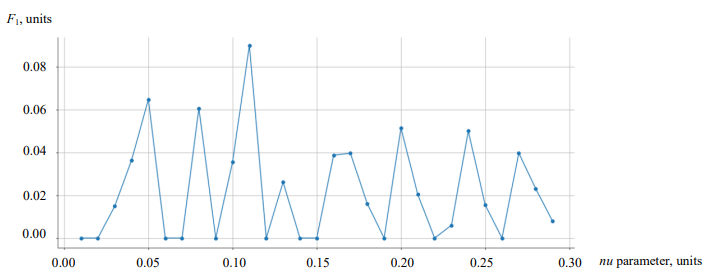
Fig. 5. Estimate of parameter nu (on the horizontal axis) for SGDOneClassSVM model. On the vertical axis — values of metric F1
To calculate the quality metric on various models, the entire data set was used through the cross-validation technique. Within one rhythm strip, we had a time series of observations taken in one continuous period of time from one person, therefore, they should be considered as dependent [15]. The following strategy was used to divide the data into training and test sets. The selected data set consisted of 213 rhythm strips marked with a unique identifier (id). This made it possible to allocate rhythm strips for training and testing models. A set of rhythm strips for the test could be randomly selected by identifiers. The approach used in the presented work is described below.
I. Five actions were performed in the data partitioning cycle.
1. The initial number for generating pseudo-random numbers was fixed (seed) —np.random.seed(fold), where fold — number of the current data partition.
2. 42 random integer values were generated in the range from 1 to 213. This was how we got random numbers of rhythm strip identifiers for the test data set.
3. The numbers of rhythm strip identifiers that remained after the selection of identifiers for the test were entered in a separate list. They were used for a training set.
4. Models were trained on rhythm strips from the training set, and prediction quality metrics were evaluated on rhythm strips from the test set.
5. The quality metric value was recorded for each model calculated on the test set of rhythm strips at the current data split.
II. Steps 1–5 were repeated for each data split number.
III. The obtained values of the quality metric were averaged for each of the models.
A comparative assessment of the average prediction quality metric for each model is given in Table 3.
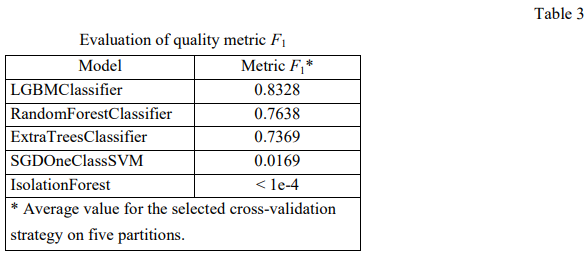
Discussion and Conclusions. A mathematical model for detecting anomalies in the heart rhythm with an accuracy of 83 % has been developed. According to quality metric F1, the model based on LGBMClassifier algorithm turned out to be the best. IsolationForest and SGDOneClassSVM showed weak results on current data.
The proposed model can be implemented as a component of the software part of wearable personal smart devices.
The proposed scenario for using the solution is as follows:
the recording of the rhythm strip is activated on a personal wearable device through the user interface;
upon completion, the record is submitted to the developed model for analysis;
based on the results of data analysis, the mathematical model issues a notification about the presence or absence of anomalies on the screen of the wearable device.
Note that an average of 4 minutes is probably enough to record one rhythm strip. During this time, it is possible to detect covid anomalies in the heart rhythm.
The model occupies 493 kilobytes in the memory of the wearable device, which is quite suitable for practical use.
The solution relies only on information about the heart rate and does not involve factors inaccessible to mobile personal gadgets.
Improving the accuracy of anomaly detection involves additional research. They should focus on the development of unique features that are detected by the initial heart rate signal. However, the current solution already makes it possible to quickly and easily assess the probability of COVID-19 at an early stage. This, along with the implementation of medical recommendations, can further contribute to reducing the risk of mortality from the negative impact of coronavirus infection on the cardiovascular system.
1. Permyakov SA, et al. Ehndogennye anomalii kardioritma u patsientov s COVID-19. In: Proc. VII All-Russian Conf. “Nelineinaya dinamika v kognitivnykh issledovaniyakh – 2021”. Nizhny Novgorod: Institute of Applied Physics of RAS; 2021. P. 109–110. (In Russ.)
2. Diagnosis of COVID-19 and Its Clinical Spectrum. Kaggle Inc. URL: https://www.kaggle.com/datasets/einsteindata4u/covid19 (accessed: 10.09.2022).
3. LightGBM: A Highly Efficient Gradient Boosting Decision Tree. www.microsoft.com URL: https://www.microsoft.com/en-us/research/wpcontent/uploads/2017/11/lightgbm.pdf (accessed: 10.09.2022).
4. Online One-Class SVM. Scikit-learn developers (BSD License). scikit-learn.org URL: https://scikit-learn.org/stable/modules/sgd.html#online-oneclass-svm (accessed: 10.09.2022).
5. Karabiber F. Gini Impurity. learndatasci.com URL: https://www.learndatasci.com/glossary/gini-impurity/ (accessed: 10.09.2022).
6. SGDOneClassSVM documentation. Scikit-learn developers (BSD License). scikit-learn.org URL: https://scikitlearn.org/stable/modules/generated/sklearn.linear_model.SGDOneClassSVM.html#sklearn.linear_model.SGDOneClassSVM (accessed: 10.09.2022).
1. Tursunova ND, Shafigulina IS, Grebennikova IV, et al. Patogeneticheskie aspekty vliyaniya COVID-19 na serdechno-sosudistuyu sistemu cheloveka. European Journal of Natural History. 2022;1:73–77. (In Russ.)
2. Molodchenkov AI, Grigoriev OG, Sharafutdinov YaN. Automatic Calculation of Disease Risk Factors Values Using Artificial Intelligence Methods and Internet of Things Technology. Journal of Information Technologies and Computing Systems. 2021;1:83–96. https://doi.org/10.14357/20718632210109
3. Polevaya SA, Eremin EV, Bulanov NA, et al. Event-Related Telemetry of Heart Rhythm for Personalized Remote Monitoring of Cognitive Functions and Stress under Conditions of Everyday Activity. Modern Technologies in Medicine. 2019;11:109–115. http://dx.doi.org/10.17691/stm2019.11.1.13
4. Kouame Amos Brou, Ivan Smirnov, Mabouh Moise Hermann. Comparison of Machine Learning Models for Coronavirus Prediction. Advanced Engineering Research (Russia). 2022;22:67–75. https://doi.org/10.23947/2687-1653-2022-22-1-67-75
5. Ashish Bhargava, Elisa Akagi Fukushima, Miriam Levine, et al. Predictors for Severe COVID-19 Infection. Clinical Infectious Diseases. 2020;71:1962–1968. https://doi.org/10.1093/cid/ciaa674
6. Krasyukova YuI, Vakhrusheva TA, Pei He Su. Machine Learning Model for Determining the Probability of Covid-19 Disease by Primary Signs. Intellektual'nye resursy — regional'nomu razvitiyu. 2021;2:67–71.
7. Alaa Tharwat. Classification Assessment Methods. Applied Computing and Informatics. 2021;17:174. https://doi.org/10.1016/j.aci.2018.08.003
8. Yupeng Xu, Hao Dong, Mingzhu Zhou, et al. Improved Isolation Forest Algorithm for Anomaly Test Data Detection. Journal of Computer and Communications. 2021;9:49–51. https://doi.org/10.4236/jcc.2021.98004
9. Bruce P, Bruce A, Gedeck P. Practical Statistics for Data Scientists, 2nd ed. Boston: OʼReilly Мedia; 2020. 342 p.
10. Breiman L. Random Forests. Machine Learning. 2001;45:5–32. https://doi.org/10.1023/A:1010933404324
11. Geurts P, Ernst D, Wehenkel L Extremely Randomized Trees. Machine Learning. 2006;63:3–42. https://doi.org/10.1007/s10994-006-6226-1
12. Kaur H, Singh G, Minhas J. A Review of Machine Learning Based Anomaly Detection Techniques. International Journal of Computer Applications Technology and Research. 2013;2:185–187. http://dx.doi.org/10.7753/IJCATR0202.1020
13. Katser ID, Kozitsin VO, Maksimov IV. NPP Equipment Fault Detection Methods. Proc. of Universities. Nuclear Power Engineering. 2019;4:5–27. https://doi.org/10.26583/npe.2019.4.01
14. Daniya T, Geetha M, Suresh Kumar K Dr. Classification and Regression Trees with Gini Index. Advances in Mathematics Scientific Journal. 2020;9:8237–8247. http://dx.doi.org/10.37418/amsj.9.10.53
15. Valliappa Lakshmanan, Sara Robinson, Michael Munn. Machine Learning Design Patterns: Solutions to Common Challenges in Data Preparation, Model Building, and MLOps, 1st ed. Boston: OʼReilly Мedia; 2020. 408 p.
Maksim S Mezhov, leading expert
53, Dubininskaya St., Moscow, 115054
Vyacheslav O Kozitsin, leading expert
53, Dubininskaya St., Moscow, 115054
Iurii D Katser, postgraduate
30, Bolshoy Boulevard, Moscow, 121205
Mezhov M.S., Kozitsin V.O., Katser I.D. Machine Learning Model for Early Detection of COVID-19 by Heart Rhythm Abnormalities. Advanced Engineering Research (Rostov-on-Don). 2023;23(1):66-75. https://doi.org/10.23947/2687-1653-2023-23-1-66-75


Advanced Engineering Research (Rostov-on-Don)
ISSN 2687-1653 (Online)
Contact with: Publisher / Editorial Office of the Journal
Publisher: Don State Technical University - DSTU, Rostov-on-Don, Russia - https://donstu.ru/en/
Editor-in-Chief: Alexey N. Beskopylny, Dr.Sci. (Eng.), Professor, Vice-Rector, Don State Technical University (Rostov-on-Don, Russia)
Don State Technical University
1, Gagarin Sq., Rostov-on-Don, 344003, Russia
tel.: +7 (863) 2738-372, e-mail: vestnik@donstu.ru
16+
Processing of personal data