Contents
Scroll to:
https://doi.org/10.23947/2687-1653-2024-24-3-293-300
EDN: PLDLKG
Scroll to:
Introduction. To improve the diagnostics of knee joint diseases, it is necessary to enhance the quality of processing radiographic images, i.e., to provide experts with more accurate information for pathology analysis. The objective of the study is to demonstrate the capabilities of fuzzy logic in improving the algorithm for determining reference lines and knee flexion angles. This requires a program that analyzes X-ray images. The methods known today, described in scientific and applied literature, are not sufficiently automated. In some cases, orthopedists and surgeons have to manually refine images and adjust lines. This gap is filled by the presented work. The algorithm developed by the author is described. It does not involve human participation and automatically identifies the lines and angles of knee flexion. Based on the result issued by the system, the doctor can, firstly, judge the presence of pathology. Secondly, the information provided by the program allows for more accurate planning, performing operations, and prescribing therapy.
Materials and Methods. Images from two X-ray machines operating in Al-Basel Hospital (Latakia, Syria) were used. The Python language was used for the software implementation of the algorithm. The solution was tested on 500 patients at Al-Basel Hospital. The results generated by the new system and previous versions of X-ray image processing programs were compared.
Results. An algorithm for constructing reference lines and angles for processing knee joint X-ray images is created, described, and implemented in practice. The capabilities of fuzzy logic in automating double threshold detection when identifying bone boundaries in images are shown. The operation of an improved Gaussian filter designed for processing X-ray images is described. The modified method of knee bone X-ray analysis includes the development of an algorithm for automatic detection of structures and anomalies in knee joints, determination and measurement of anatomical parameters, assessment of the degree of damage, etc. The method for determining the contour boundaries on radiographs combined the Canny detector, the watershed algorithm, and fuzzy logic. The program has been implemented in medical practice and shows 98% accuracy, spending less than 20 seconds to process the image.
Discussion and Conclusion. The new system provides high accuracy, acceptable efficiency, and does not require manual correction of images. Experts are now able to identify subtle indicators of disorders. In addition, the new method makes it possible to understand complex cases when several factors are combined, indicating potential pathology. Widespread implementation of the method will improve the quality of medical services in orthopedics. Scientific research in this direction should be continued to expand the set of strategies for the treatment of diseases of the musculoskeletal system. It is necessary to create solutions with absolute accuracy, higher processing efficiency, as well as methods suitable for analyzing other joints.
Mannaa A.S. Algorithm for Processing X-ray Images Using Fuzzy Logic. Advanced Engineering Research (Rostov-on-Don). 2024;24(3):293-300. https://doi.org/10.23947/2687-1653-2024-24-3-293-300. EDN: PLDLKG
Introduction. Improving the quality of X-ray images is a critical task with direct implications for the quality of medical diagnosis and subsequent treatment, especially in cases like joint replacement surgeries. Advancements in medical imaging technologies, including X-ray imaging, are vital for providing more accurate and detailed information to healthcare professionals. There are some strategies and advancements that can help improve X-ray image quality and subsequently benefit joint replacement surgeries and other medical procedures.
Analysis of X-ray images allows identifying and evaluate various pathological conditions [1]. Algorithms for image segmentation and bone delimitation have made a significant contribution to improving the clarity and accuracy of X-ray image interpretation. However, such visualization still needs improvement, as it is not always completely defined, leaving room for different interpretations [2].
Advances in intelligent computing make it possible to use fuzzy logic to remove imprecision and ambiguity in the medical image analysis. Fuzzy logic mimics human thinking, and it is a reliable basis for creating algorithms that can efficiently process and analyze X-ray images [3].
In [4], reference lines and their relationships were studied for the purpose of correcting the shape of the legs.
In [5], clinical results of treating multiaxial deformities of the lower extremities were compared to how this was reflected in X-ray images. The literature describes software products that can analyze X-ray images of bones. However, all these systems have a common drawback: sometimes they incorrectly recognize contours. If this happens, the specialist manually refines the image. This problem is solved in the presented scientific work. A new algorithm for analyzing X-ray images is proposed using fuzzy logic and improved traditional approaches. The solution eliminates the need for manual image processing. The program operates with high accuracy and ample efficiency. It allows for more accurate detection and characterization of anomalies in X-ray images, i.e., improves diagnostics.
Materials and Methods. In carrying out this scientific work, the author proceeded from the fact that the assessment of limb deformations requires an analysis of the anatomical and mechanical axes of long bones, as well as the angles between them. Figure 1 shows the initial limits of angles for healthy people of different ages. If the indicator is outside these limits, then the patient has a deformed limb and needs surgical intervention.
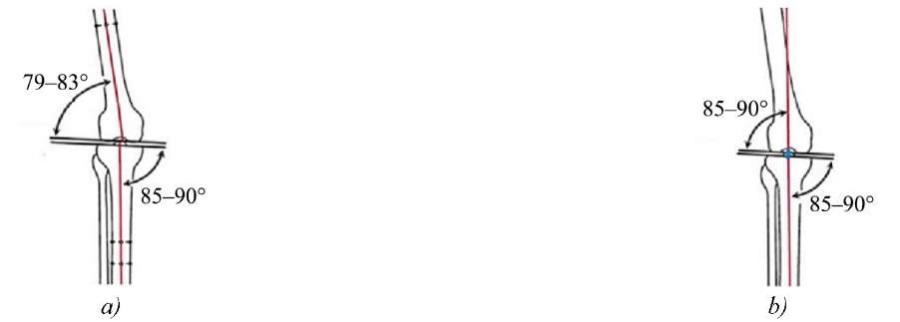
Fig. 1. Support angles between mechanical axes for healthy people:
a — for young people; b — for elderly people [4]
In orthopaedics, the concepts of mechanical and anatomical axis are crucial to understanding the arrangement and function of bones, especially in the lower extremities. The anatomical axis runs through the center of the bone shaft, through the middle of the diaphysis. The mechanical axis reflects the direction of the forces acting on it. In the lower extremities, it runs from the center of the hip joint to the center of the ankle joint.
By examining the mechanical axis, it is possible to understand the load-bearing capacity and load distribution in the bone. This is particularly important for the diagnosis and treatment of osteoarthritis, fractures, and for determining the position of implants or prostheses.
It is necessary to know the features of the anatomical axis to distinguish natural curvature from pathological curvature. This is also important under surgical interventions, since it helps surgeons understand whether the bone is positioned correctly.
Two parameters are particularly important for assessing the anatomy of the femur and tibia:
They are extremely informative when it comes to identifying knee deformities. ALDFA determines the orientation of the distal femur relative to its longitudinal axis, MPTA shows the inclination of the medial surface of the tibia relative to its mechanical axis (Fig. 2).
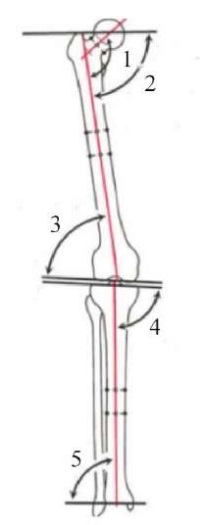
Fig. 2. Angles between femur and tibia used to assess anatomy and detect pathology:
1 — medial genu-diaphyseal angle (MGDA) = 130° (124°–136°);
2 — medial proximal femoral angle (MPFA) = 84° (80°–89°);
3 — ALDFA = 81° (79°–83°);
4 — MPTA = 87° (85°–90°);
5 — lateral distal tibial angle (LDTA) = 89° (85°–92°) [5]
The angles shown in Figure 2, in combination, demonstrate the possibilities of knee joint alignment or deformation. Orthopedists use the norm (numbers in brackets) to draw conclusions about the type, severity of deformations, and develop a treatment plan [6].
The Canny edge detection algorithm is a robust method widely used to identify boundaries in images. It builds reference lines and angles from X-ray images as follows. The first step uses an improved Gaussian filter, which smoothes the image, reduces noise [7]. Next, gradients are calculated using the Sobel or Prewitt operators. The method is often used to detect the image edges. This allows both weak and strong edges to be taken into account. This way, the algorithm determines the edges more accurately and reduces the noise level more effectively.
Despite its computational complexity, the Canny algorithm remains a fundamental part of computer vision due to its ability to cope with noise and clearly detect edges.
To correctly select the standard deviation value, the absolute values of the point x(i, j) in the gray pixel are compared [8]. If |x(i, j)| < |x(i, j)| × |x(i, j) − μ|, then the standard deviation σ = 1. In this case, the point is less affected by noise. Standard deviation σ = 1.6 indicates significant noise.
To automatically detect the edges (T1, T2), Canny uses double thresholding, classifying pixels in the image by gray intensity. We calculate the average value of all pixels (T1), after which T1 is used to divide the image into two
areas — object and background. Pixel values that exceed the initial threshold T1 are taken as objects, and the rest are taken as background. Now there are two sets of values: one for the object (ob) and one for the background (bg). For each of the two regions (object, background), a threshold value is calculated. Let us calculate T2. We start with the fact that:
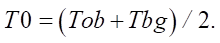 (1)
(1)
New value T0 is taken as T1, and the process is repeated until T0 ~= T1. Final value T0 is taken as T2.
The final step involves boundary binding to identify related boundary components in the VNSA (valgus knee shaft angle) image. This helps to combine disparate boundaries into larger structures, which improves image perception and analysis. It is advisable to integrate fuzzy logic principles and traditional software approaches to edge detection. In this case, membership functions are used that assign membership degrees to pixels based on gray intensity values, allowing for a detailed representation of edges.
Unlike the binary approach, the fuzzy method facilitates a gradual transition in the range of membership values from 0 (no membership at all) to 1 (full membership), capturing the inaccuracies of the boundaries. Fuzzification transforms crisp image data into fuzzy sets, taking into account the uncertainty. Defuzzification transforms fuzzy results into crisp ones for further analysis.
A notable advantage of the method is its adaptability to real-world scripts, specifically to those with varying degrees of noise and ambiguity. However, careful parameter tuning may be required to achieve optimal performance; therefore, finding a balance between sensitivity and specificity in edge detection applications is critical [9].
A more detailed representation of edges can be achieved by disambiguating image boundaries. This requires assigning membership degrees to pixels.
Each pixel is processed using fuzzy rules. If any of the fuzzy rules shown in Figure 3 are met, the pixel is processed as an edge, otherwise it is not taken into account. This provides highlighting the boundaries of objects that are different from noise and other image elements. The importance of this solution has been proven in relation to the analysis of the humerus from X-ray images [10].
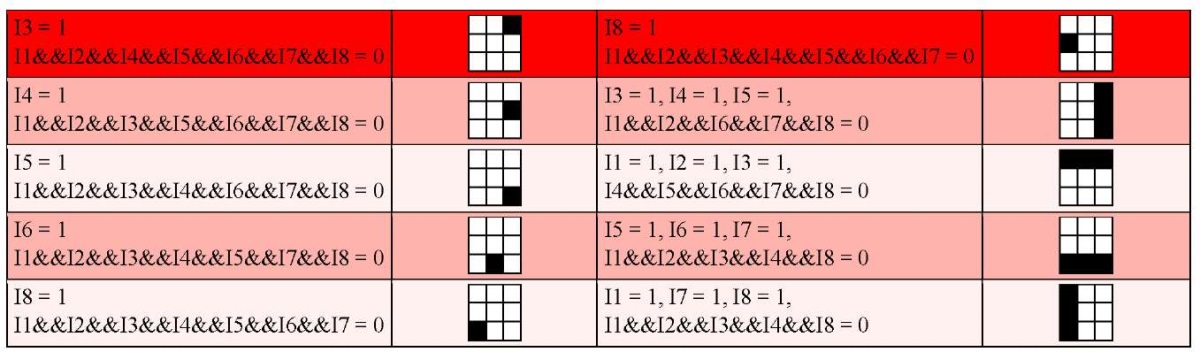
Fig. 3. Fuzzy logic rules
The watershed segmentation algorithm is used in computer vision to recognize objects. It was originally developed for cartography. And now it perceives images as a topographic landscape, where the grayscale intensity corresponds to the terrain elevation. Watershed lines outline individual objects as boundaries between drainage basins. By filling the landscape from local minima, the algorithm separates objects by the intensity of gray color.
The watershed detection algorithm is effective for some applications, but it can be sensitive to noise and may cause over-segmentation. In practice, careful preprocessing and marker-driven watershed options are used to improve performance [11].
The watershed algorithm output is shown in Figure 4.
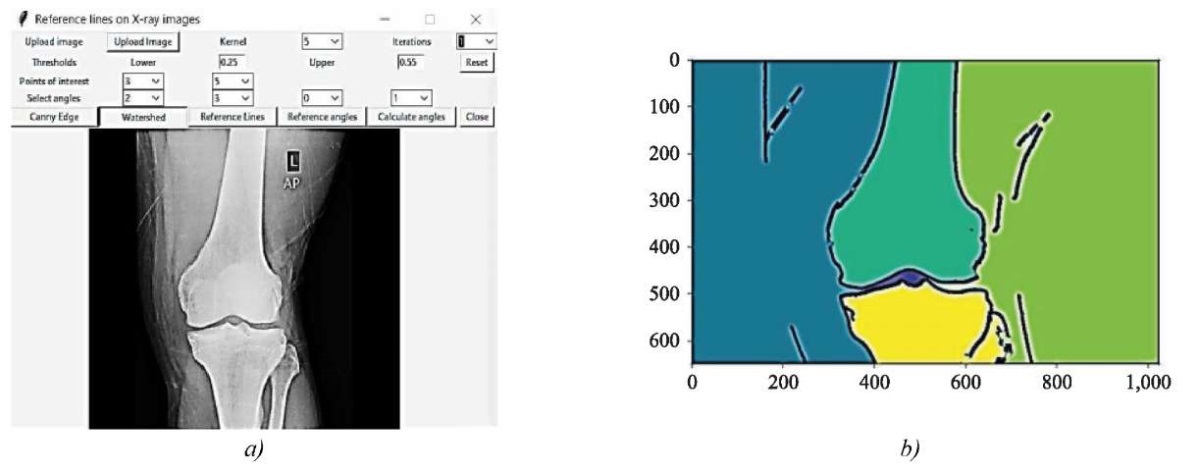
Fig. 4. Watershed algorithm output: a — original image; b — result of watersheds
Research Results. After using the watershed algorithm, boundaries were drawn for the points under study [12]. To construct reference lines, the extreme points were calculated along the boundary of the mark (selected region) of the bone. Then, the center of mass was calculated, the image was converted to binary format, and its center was found. Having determined the extreme points on four sides, we took the middle of the top of the upper bone, the middle of the base of the lower bone and drew a line.
We used the formula for calculating the angle between two lines and three coordinate points: aa, bb and cc. Two are the extreme points of both lines, and one is the common point of their intersection [13].
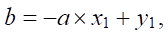 (2)
(2)
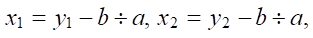 (3)
(3)
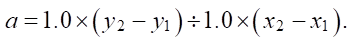 (4)
(4)
Figure 5 shows the result of constructing reference lines and angles on X-ray images.
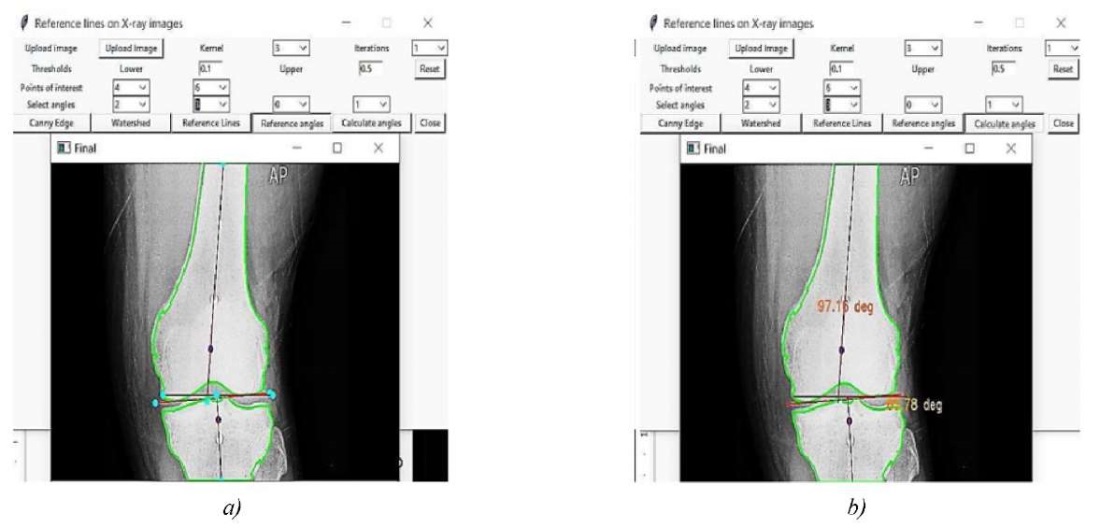
Fig. 5. Results of using the improved watershed algorithm on X-ray images:
a — construction of reference lines; b — calculation of angles
The performance of the Canny edge detector [14] was compared to the results of the new algorithm proposed by the author. The higher performance of the latter solution is obvious. This is explained, firstly, by the improvement of the Canny operator. Secondly, the new method is integrated with an improved Gaussian filter. Therefore, there is no need for an additional filter, and the execution time of the algorithm is reduced. Its implementation has significantly increased the accuracy and yielded better results, specifically for images of radial lines with high noise levels.
The new solution was implemented at Al-Basel Hospital in Latakia, Syria. Images from two X-ray machines were used. The program was applied to X-ray images of 500 patients. In 490 cases, no manual processing was required, i.e., the accuracy of the results was 98%. Image processing took about 20 seconds.
The proposed algorithm is implemented in Python with a graphic interface. The scheme for creating reference lines and angles for processing X-ray images of the knee joint is designed to improve the interpretation of X-ray images (Fig. 6).
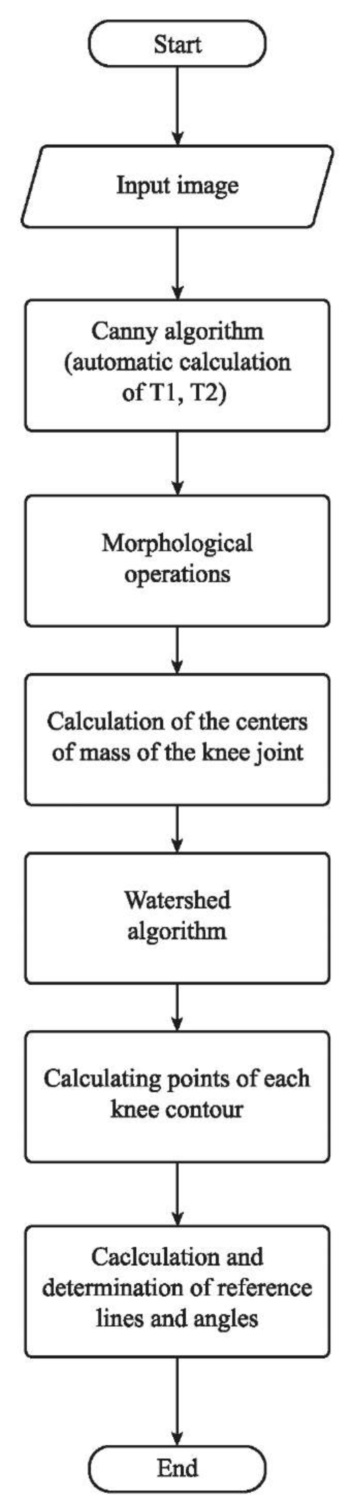
Fig. 6. Improved algorithm for creating reference lines and angles
for processing knee joint X-ray images
Discussion and Conclusion. A new approach to knee X-ray imaging is being used at Al-Basel Hospital (Latakia, Syria). The practice has shown the value of advanced automated image analysis in improving diagnostic accuracy. It should be noted that even an earlier version of the program effectively identified bone abnormalities that were missed by visual analysis [15]. With the help of the proposed solution, orthopedists can qualitatively work through subtle factors indicating violations, as well as combinations of indicators that can cause confusion and hinder the detection of pathology. It follows that the use of the approach described in this article allows us to reasonably expect an increase in the quality of medical services in the field of orthopedics and surgery. Specialists receive tools for more precise planning and execution of operations. In addition, the new solution opens up opportunities for better organization of conservative treatment taking into account the individual characteristics of the pathology.
Scientific research in this line should be continued to expand diagnostic capabilities and a range of treatment strategies for musculoskeletal diseases. Of particular interest is achieving absolute, i.e., 100% accuracy in algorithmic determination of the lines. The time for image processing should also be reduced. Optimization of computational processes will provide obtaining results faster, which is particularly important in emergency diagnostics. In addition, it is advisable to refine the method for analyzing more complex clinical cases. Another promising direction is adapting the algorithm for analyzing other joints, such as hip or shoulder joints.
1. Al-Temimi Ammar Mudheher Sadek, Pilidi VS. On an Algorithm for Structure Analysis of X-ray Medical Images. University News. North-Caucasian Region. Technical Sciences Series. 2018;197(1):23–28. https://doi.org/10.17213/0321-2653-2018-1-23-28
2. Jassam KI. Removal of Random Noise from Conventional Digital X-Ray Images. International Archives of Photogrammetry and Remote Sensing. 1993;29:113–118. https://doi.org/n10y2021/7227
3. Ruiyuan Liu, Jian Mao. Research on Improved Canny Edge Detection Algorithm. In: Proc. 2nd International Conference on Electronic Information Technology and Computer Engineering, (EITCE). MATEC Web of Conferences. 2018; 232(4):03053. https://doi.org/10.1051/matecconf/201823203053
4. Kulesh PN, Solomin LN. Relationships between Reference Lines Altered during Leg Shape Correction as Requested by the Patient Orthopaedic Genius. 2021;27(3):390–397. https://doi.org/10.18019/1028-4427-2021-27-3-390-397
5. Riganti S, Nasto LA, Mannino S, Brunenghi GM, Boero S. Correction of Complex Lower Limb Angular Deformities with or without Length Discrepancy in Children Using the TL-HEX Hexapod System : Comparison of Clinical and Radiographical Results. Journal of Pediatric Orthopaedics B. 2019;28(3):214–220. https://doi.org/10.1097/BPB.0000000000000573
6. Gaidel AB, Pervushkin SS. Research of the Textural Features for the Bony Tissue Diseases Diagnostics Using the Roentgenograms. Computer Optics. 2013;37(1):133–119. https://doi.org/10.18287/0134-2452-2013-37-1-113-119
7. Weibin Rong, Zhanjing Li, Wei Zhang, Lining Sun. An improved Canny Edge Detection Algorithm. In: Proc. IEEE International Conference on Mechatronics and Automation (ICMA). New York City: IEEE; 2014. P. 577–582. https://doi.org/10.1109/ICMA.2014.6885761
8. Kaur EK, Mutenja V, Gill EIS. Fuzzy Logic Based Image Edge Detection Algorithm in MATLAB. International Journal of Computer Applications. 2010;1(22):55–58. http://doi.org/10.5120/442-675
9. Haibo Zhou, Hao Ying. A Method for Deriving the Analytical Structure of a Broad Class of Typical Interval Type-2 Mamdani Fuzzy Controllers. IEEE Transactions on Fuzzy Systems. 2013;21(3):447–458. http://doi.org/10.1109/TFUZZ.2012.2226891
10. Abdelwahed Motwakel, Adnan Shaout, Gasm Elseed Ibrahim Mohamed. Dry Fingerprint Image Enhancement Using Fuzzy Morphology. International Journal of Knowledge Engineering and Data Mining. 2016;4(1):40–53. https://doi.org/10.1504/IJKEDM.2016.082074
11. Suhas S, Venugopal CR. An Efficient MRI Noise Removal Technique Using Linear and Nonlinear Filters. International Journal of Computer Applications. 2018;179(15):17–20. https://doi.org/10.5120/IJCA2018915777
12. Anam S, Uchino E, Misawa H, Suetake N. Texture Analysis and Modified Level Set Method for Automatic Detection of Bone Boundaries in Hand Radiographs. International Journal of Advanced Computer Science and Applications. 2014;5(10):117–126. https://doi.org/10.14569/IJACSA.2014.051017
13. Al-Temimi Ammar Mudheher Sadek, Pilidi VS. Automating the Process of Determining the Reference Lines on the X-ray Medical Images. Engineering Journal of Don. 2017;44(1):27–36. URL: http://www.ivdon.ru/uploads/ article/pdf/IVD_55_Temimi_Pelidi.pdf_02dcdf3989.pdf (accessed: 25.05.2024)
14. Mannaa AS, Muratova GV. Development of Algorithm for Constructing Reference Lines and Angles for Knee Joints on X-ray Images. Bulletin of Higher Educational Institutions. North-Caucasian Region. Natural Sciences. 2023;218(2): 15–20. https://doi.org/10.18522/1026-2237-2023-2-15-20
Ali Sajae Mannaa, Postgraduate Student, Department of Informatics and Computational Experiment, Vorovich Institute of Mathematics, Mechanics and Computer Sciences
21e, Zorge Str., Rostov-on-Don, 344015
Mannaa A.S. Algorithm for Processing X-ray Images Using Fuzzy Logic. Advanced Engineering Research (Rostov-on-Don). 2024;24(3):293-300. https://doi.org/10.23947/2687-1653-2024-24-3-293-300. EDN: PLDLKG


Advanced Engineering Research (Rostov-on-Don)
ISSN 2687-1653 (Online)
Contact with: Publisher / Editorial Office of the Journal
Publisher: Don State Technical University - DSTU, Rostov-on-Don, Russia - https://donstu.ru/en/
Editor-in-Chief: Alexey N. Beskopylny, Dr.Sci. (Eng.), Professor, Vice-Rector, Don State Technical University (Rostov-on-Don, Russia)
Don State Technical University
1, Gagarin Sq., Rostov-on-Don, 344003, Russia
tel.: +7 (863) 2738-372, e-mail: vestnik@donstu.ru
16+
Processing of personal data