Contents
Scroll to:
https://doi.org/10.23947/2687-1653-2025-25-2-99-111
EDN: DGHAFZ
Scroll to:
Introduction. Electrolytic plasma technologies used for dimensional and finishing processing of metal surfaces attract attention due to their high efficiency and precision. The key factor that determines the quality of processing is the temperature of the electrolytic-plasma discharge (EPD), which affects the ionization of the electrolyte and the properties of the surface. The lack of comprehensive studies of the temperature characteristics of jet EPD limits the optimization of processes. The research objective is to determine the distribution of temperatures and heat flows in the system “jet electrolytic cathode — metal anode” under various processing conditions.
Materials and Methods. The study was conducted using an electrolyte jet with a diameter of 3 mm and a mass flow rate of 0.25–3.75 g/s at a voltage of 20–500 V. KhVG and 08Kh18N9T steels were used as anodes, and the electrolytes were aqueous solutions of NaCl, (NH4)2SO4, C6H8O7, with a concentration of 4–50 g/l. The temperature was measured with a chromel-alumel thermocouple, an infrared pyrometer, and a thermal imager.
Results. A heat balance equation was developed, describing heat distribution among the metallic anode (MA), jet cathode, electrolyte, vapor, and radiation. The analysis of the volt-ampere characteristics (VAC) showed an increase in current at low electrolyte flow rates (0.75–1.2 g/s) followed by a decrease at 300–500 V, and a parabolic dependence with a maximum of 2.6 A at a flow rate of 2.37 g/s. The maximum MA temperature reached 100°С (NaCl, 4–35 g/L), decreasing to 82°С at 150 g/L, while the hollow cathode reached 158°С at an initial electrolyte temperature of 90°С. Vapor temperatures ranged from 67.3°С (high flow rates) to 87.5°С (low flow rates). Electrolyte loss due to evaporation reached 5,8 g at 300–340 The temperature at the periphery of the anode was 15–20% higher than in the center.
Discussion and Conclusion. The main source of heat was the Joule-Lenz law, with the contribution of exothermic reactions of carbon oxidation up to 260 V. The maximum heat release was observed in the EPD zone, forming an ellipsoid. The data obtained and the heat balance equation create the basis for optimizing jet electrolytic-plasma polishing in mechanical engineering, medicine, and microelectronics.
Popov A.I., Novikov V.I., Ivanov D.N., Kozyrskiy I.A. Analysis of Temperature Characteristics of Electrolytic-Plasma Discharge in Jet Processing of a Metal Anode. Advanced Engineering Research (Rostov-on-Don). 2025;25(2):99-111. https://doi.org/10.23947/2687-1653-2025-25-2-99-111. EDN: DGHAFZ
Introduction. Currently, electrolytic plasma technologies are increasingly used in various industries. One of the most promising areas of their application is local processing of conductive metal surfaces [1]. This method is characterized by a number of technology abilities. Depending on the conditions of plasma formation, an electric discharge (ED) can occur both at atmospheric pressure [2] and in low vacuum conditions [3]. According to the method of plasma supply to the surface of the product, the treatment of ER in air [4] and in an electrolytic bath [5] is distinguished. It is possible to supply a stream of electrolyte from a metal [6] or plastic tube [7], as well as applying buried current leads of various designs [8]. The composition of the operating environment in which aqueous solutions of electrolytes are used can have a concentration from fractions of a percent [9] to their complete saturation [10]. There are known cases of additional introduction of inert gases (Ar, Kr) into the electrolytic plasma as an operating environment [11]. According to spatial orientation, there are different directions of the electrolyte flow (current lead) relative to the product: from above [12], from below [13], and at an angle [14]. The product itself, in turn, can be located vertically [14], horizontally, or at an angle to the axis of the stream (current lead) [10].
The formation of a limited ED volume involves moving it relative to the surface of the workpiece manually or according to a CNC (industrial robot) machine program. In this case, depending on the input parameters, the ED is formed in the electrolysis mode [15], electrolytic plasma [16] or a combination of these processes. The movement of the ED relative to the surface of the metal anode at a given feed rate provides the achievement of the required values for dimensionless (dimensional) processing, the accuracy of the size being performed, and the required parameters: Ra — average arithmetic deviation of the profile, and Rmax — greatest height of the material profile.
In [17], the technologies of jet focused electrolytic plasma treatment are studied. The specific feature of the processes of jet electrolytic-plasma treatment, in comparison to processing in an electrolytic bath [18], can be a significantly higher processing speed, dimensional and dimensionless treatment, local processing zone, lower equipment cost, higher processing accuracy [19], and incomparably lower roughness parameters [20]. This opens up prospects for even more active use of jet processing methods.
However, the widespread application of jet technologies with an electrolytic electrode and a metal anode is hindered by the lack of information on the operating temperatures of the process in the treatment zone and on the surface of the metal anode. This fact is important, since numerous studies on plasma heating of products in flowing and stationary electrolytes show the presence of high temperatures, up to the melting point [21]. In addition, studies on the plasma discharges themselves demonstrate plasma temperatures from 1,400 to 4,000°K [22].
The interaction of the ED with the metal anode, when the temperature of phase transformations in alloys is exceeded, reduces the performance of manufactured products. There are a limited number of studies in the field of integrated temperature and heat flow distribution in the “hollow current lead – electrolytic cathode – MA – environment” system. These studies, as a rule, describe only the local part of the system.
The research objective was to analyze temperatures in the system obtained by an electric discharge between a metal cathode and a metal anode at atmospheric pressure. To achieve this, the authors solved the following problems: the volt-ampere characteristics of the discharge were studied; the temperature of the steam, anode, hollow cathode (current lead), electrolyte in the receiving bath was measured; and the distribution of heat flows was analyzed.
Materials and Methods. An electric discharge formed in the voltage range (U = 20–500 V) at low electrolyte flow rates (0.25–3.75 g/s) and small interelectrode gaps (2–8 mm) was investigated for a free-falling electrolyte jet of Ø3 mm on the surface of a metal anode with the application of a constant bias voltage between the metal anode and the hollow cathode tube.
The diagram of local temperature measurement locations is shown in Figure 1.
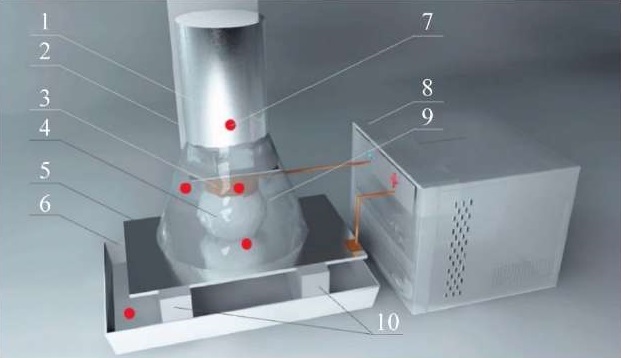
Fig. 1. Layout of temperature measurement points: 1 — electrolyte feeder; 2 — copper tube (hollow cathode) fastener; 3 — copper tube; 4 — foamed electrolytic stream; 5 — metal anode; 6 — electrolyte receiving bath; 7 — temperature measurement points; 8 — power source; 9 — heat-insulating screen; 10 — supports on insulators
The studies were conducted at room temperature (T = 20.0°C) in the pressure range (9.9–10.1)×10⁴ Pa. For MA, 25 marked samples with a diameter of 45×1 mm were made. The sample material was KhVG tool steel. Samples made of 08Kh18N9T stainless steel with dimensions of 100×200×1 mm were also used. Samples made of KhVG steel were treated with a NaCl solution in tap water at a concentration of 3–160 g/l. Samples made of 08Kh18N9T steel were treated with (NH4)2SO4 at a concentration of 2–55 g/l and C6H8O7 at a concentration of 10–35 g/l in tap water. The discharge voltage varied from 20 to 500 V with a step of 20 volts. The interelectrode gap L was varied in the range from 2 to 8 mm. The voltage and current were measured with a UT61B millivoltmeter with an accuracy of ± (0.5% + 1) for voltage and ± (1.5% + 3) for current. The unit of mass flow rate of electrolyte G was equal to 0.2–3.8 g/s. A mass of 100 g was taken as a fixed mass of electrolyte for passing through the hollow cathode tube. The mass loss Δэ was determined on a scale with an accuracy of 5×10⁻⁵ kg. The mass loss was calculated as the difference between the initial mass of electrolyte poured into the electrolyte feeder and the final mass collected in the electrolyte receiving bath after the electric discharge. The hollow cathode temperature was measured by an insulated junction of a chromel-alumel thermocouple installed 2 mm above the lower end of the current lead tube.
The temperature of the MA was measured by a thermocouple installed at a distance of 0.3 mm from its surface, built into a protective stainless housing. The temperature was measured by contact with a chromel-alumel thermocouple and by contactless means with a TA601C infrared pyrometer and a Testo 875 thermal imager. The height of the electrolyte feeder above the sample surface was 300 mm. The samples were given an angle of inclination of 3–5° for electrolyte flow. The distance between the MA and the bottom of the electrolyte receiving bath was 40 mm for KhVG steel and 200 mm for 08Kh18N9T steel. 3D models were simulated in the Cinema4D program.
Research Results. Initial Heat Flow in ED. Numerous studies have shown that the range of operating voltages U from 0 to 500 V can be conditionally attributed to two main processes. The first corresponds to the process of anodic dissolution during electrolysis and is widely used in industry in the range of 12–60 V. It is accompanied by intensive heating of the anode and in some cases is used for the process heating of workpieces. The second process conditionally corresponds to the range of operating voltages from 60 to 500 V and to the electrolytic-plasma mechanism [15]. This process is used for heating anode materials, chemical-thermal treatment, coating, microarc oxidation, cleaning, and polishing. Electrolytic plasma treatment is characterized by a wide temperature range. It depends on the ratio of the sizes of the current leads used. For example, when two current leads are immersed in an electrolytic bath, the smaller of them starts to actively generate heat. Thus, a loop of 0.8 mm thick nichrome wire placed around the MA plate is locally heated and burns out in less than 60 s, forming a ball at the end closest to the anode.
When the ratio of the sizes of the active electrode to the larger one is ≤ 3–5, an effervescence occurs on the surface of the first one, and with increasing voltage, a “thin luminous plasma shell” appears [16], which turns (for anodic processes) into an anode shell of significantly larger dimensions [8].
The interaction zone of the MA and the plasma (gas-vapor) shell is characterized by the size, intensity, resistance, ionization of the components. The size of the electrolyte-plasma (anodic) shell for different cases can be 10–500 μm above the MA surface. This layer corresponds to high resistance (specific electrical conductivity of the layer is 1.1 ∙ 10⁵ Ohm ∙ cm⁻¹) [16].
In this case, the high electric field strength of 10⁴–10⁶ V/m (in the case of an electrolytic bath) provides ionization of the components of air, steam, and electrolyte. With an increase in voltage, the process is accompanied by visible glow and the presence of microdischarges that occur mainly at the tops of microroughnesses, and when leveling the surface — on blocks, dislocations, or individual atoms. The shell, depending on the composition of the electrolyte, has a characteristic glow up to white with an electron gas temperature from 1,400 to 4,000°К [22]. Depending on the conditions, the material of the MA, the shape of the negative current lead, the concentration and type of electrolyte, the capacity and number of capacitors of the power source, the ED can take the character of a discharge similar to a glow, spark or arc discharge.
The discharge zone during electrolysis and the occurrence of an electrolyte-plasma discharge in the case under consideration is a local area. This determines the heat flows propagating from this area. Heat release in the ED occurs on the MA surface in the electrolyte-plasma layer zone and is directed into the MA, electrolyte, steam, hollow cathode, and into the environment in the form of radiation.
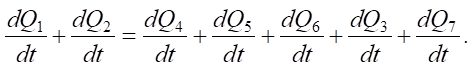
The relationship linking the release and consumption of heat in the system “hollow cathode – electrolytic electrode – MA” per unit of time can be written in general form by the heat balance equation:
 (1)
(1)
The left side of the equation defines the initial amount of heat released in the electrolyte-plasma layer. It consists of  — amount of heat released according to the Joule-Lenz law, and
  — amount of heat released by the oxidation of carbon in steel [13].
The right side of the equation shows the heat flows from the ED zone.
Expressions 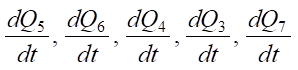 are heat flows directed into the hollow cathode, into the flowing electrolyte, into the MA, into the environment in the form of steam.
When determining parameters I and U for calculating the initial heat flux arising in the ED, the volt-ampere characteristics were obtained for a NaCl solution at different electrolyte flow rates — from 0.75 to 2.37 g/s. It was shown that in the voltage range from 20 to 500 V, at a low electrolyte flow rate, G = 0.75 g/s and G = 1.20 g/s, an increase in the electric discharge current was observed with a characteristic decrease in the range of 300–500 V. With an increase in the electrolyte flow rate to G = 2.37 g/s in the range of 20–500 V, the curve had the form of a flat parabola branch and a maximum current value 2.6 A. In this case, the current density per MA could reach 3.2–5.2×10⁴ A/m².
Study on Volt-Ampere Characteristic. Up to U = 240 V, the difference in discharge current between the three curves is in the range of 0.2–0.4 A (Fig. 2). After U = 240 V, the differences between curves 1 and 2 become more significant. For curves 2 and 3, in the range of U = 180–400 V, there is almost complete coincidence of values. The most significant differences between them start at point U = 400 V and range from 0.4 to 1.4 A for the highest G = 2.37 g/s and the lowest G = 0.75 g/s of electrolyte consumption.
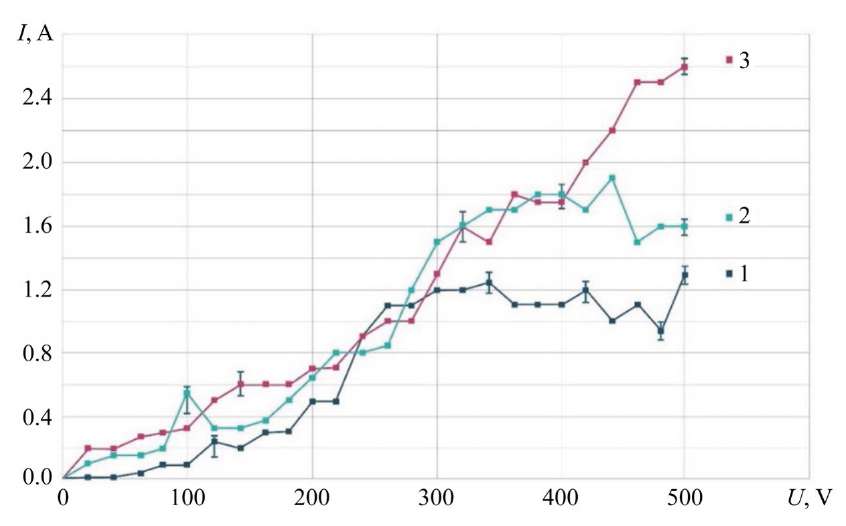
Fig. 2. Dependence of VAC of electric discharge between electrolytic cathode and MA on electrolyte consumption; MA — KhVG steel; NaCl — 4 g/l; 1 — G = 0.75 g/s; 2 — G = 1.20 g/s; 3 — G = 2.36 g/s
Study on MA Temperature. Study on the heat flow in the MA from the ED was performed on a sample made of KhVG steel. A thermocouple in a protective housing made of stainless steel was tightly fixed on the back side of the MA at a distance of 0.3 mm from the surface.
The MA temperature was measured at different values of the concentration of the electrolyte based on NaCl. The temperature values were taken after the steady-state heat flow (Fig. 3).
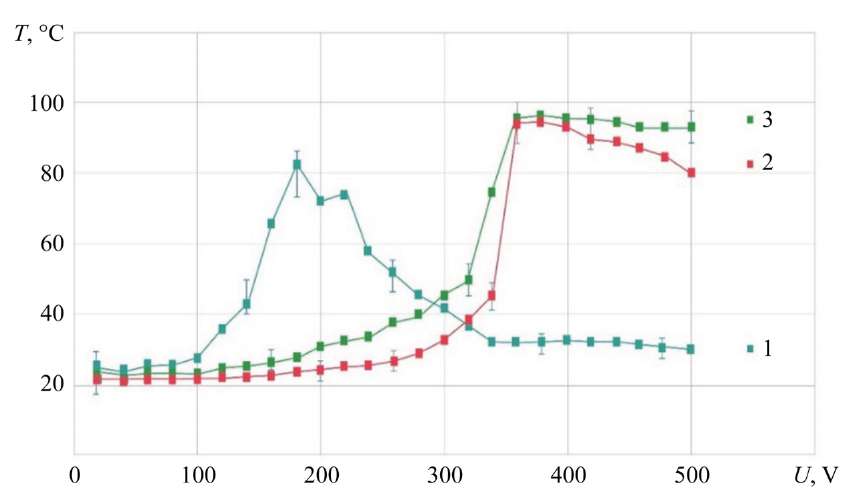
Fig. 3. Dependence of MA temperature on ED voltage; MA — KhVG steel; G = 1.14 g/s; electrolyte with NaCl concentration: 1 — 4 g/l; 2 — 35 g/l; 3 — 150 g/l
It is shown that at the electrolyte concentrations of NaCl 4 and 35 g/l up to the range of U = 320–340 V, the curves have a flat character, which may indicate stable electrolysis processes in this range and at these concentrations of the electrolyte. In the range of U = 320–360 V, a sharp increase in the anode temperature is recorded on these curves. Obviously, this region is a transitional one, characterized by an increase in the double layer and a change in the mechanism of transfer of MA atoms.
The increase in the double layer insulating the MA surface occurs simultaneously with the growth of the electric field strength. When the breakdown voltage is exceeded, a microdischarge occurs, destroying the nonconductive film formed on the surface. Both the peaks of the surface profile microroughness and the areas between the depressions are the zone of microdischarge occurrence with developed surface roughness. The occurrence of a microdischarge at the top and in the area of the depressions is caused by the high intensity of the electric field. In the first case, the cause is the shape of the protrusion itself, and in the second case — the presence of a high charge on the surface between the depressions. It can be caused by a high negative charge of nonconductive films (contamination, anode layer, spray products).
The mechanism of material transfer from the surface of the metal anode is changed in two stages. First, the chemical weakening of atomic bonds occurs under the action of electrolyte components, which facilitates the detachment of electrons and atoms. Then, when microdischarges are formed, the thermal mechanism of destruction of these bonds becomes predominant. This causes additional emission of electrons and promotes further interaction of the anode with the electrolyte, leading to the removal of its atoms into the solution.
In the range of U = 360–500 V, a smooth decrease in temperature is recorded for curves 1 and 2, which may indicate an increase in the locking effect. It is characterized by an increase in the nonconductive film, a decrease in the discharge current, an increase in the power of individual microdischarges, but a decrease in the number, and consequently, the amount of heat released in the electrolyte-plasma layer.
With an increase in the salt (NaCl) concentration to 150 g/l (curve 3) in the electrolyte, the region of maximum temperatures shifts to the region of lower voltages, from 360 to 180 V. Obviously, this also reduces the ignition threshold of the electrolyte-plasma discharge. In this case, the crimson glow characteristic of the formation of the electrolyte-plasma layer was already recorded for NaCl at U = 140 V. In addition, it is noted that with an increase in the concentration of the electrolyte, a decrease in the maximum temperature to 82°C is observed. For a saturated NaCl solution, an ED is formed in the shape of an ellipsoid truncated on both sides at U = 160 V and U = 200 V. This corresponds to the region of maximum temperatures.
In general, it can be noted that the temperature near the contact surface with the electrolyte plasma on the metal anode does not exceed 100°C. The difference in the voltage range U = 320 – 340 V is characteristic for curves 1 and 2. This determines the transition to ED in the form of an ellipsoid truncated on both sides with a maximum temperature [9].
Study on Hollow Cathode Temperature. The hollow cathode temperature was measured by fixing the thermocouple junction, insulated from the surface of the current lead. The thermocouple junction was installed on the outer side of the current lead above 2 mm from the lower end of the tube. It was recorded that for all experiments (Fig. 4, curves 1, 2, 3), having different initial electrolyte temperatures at the input of the hollow cathode, areas with a virtually constant temperature were characteristic. These areas included the voltage range of U = 20–260 V.
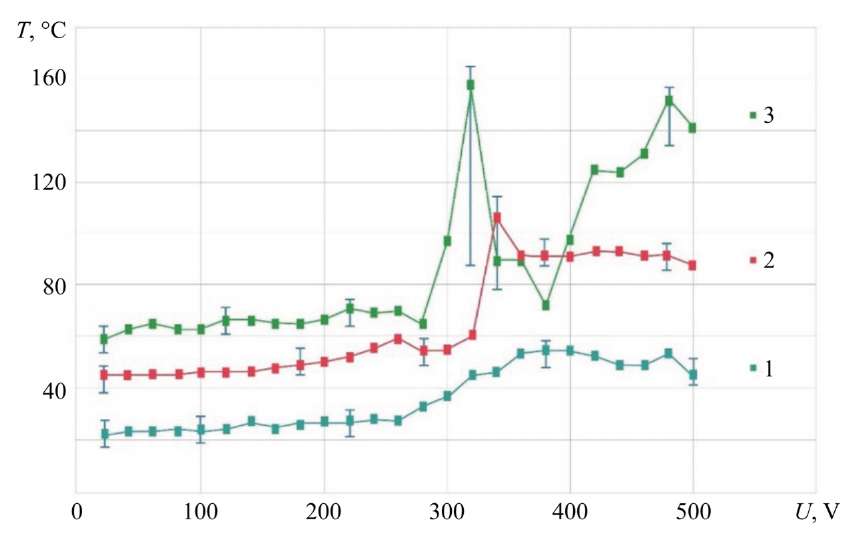
Fig. 4. Dependence of the hollow cathode temperature on voltage when using NaCl electrolyte — 4 g/l; MA — KhVG steel; G = 1.06 g/s; 1 — T = 21°C; 2 — T = 50°C; 3 — T = 90°C
It was noted that at the initial temperature of the electrolyte (T =21°C), supplied to the hollow cathode, the surface temperature of the current lead tube at the measurement location did not exceed 60°C (curve 1). This is generally consistent with the data obtained by the authors of paper [2].
Increasing the initial temperature of the electrolyte to T = 50°C showed that in the range of U = 20–340 V, the temperature of the hollow cathode remained virtually unchanged (curve 2). However, from value U = 340 V, a sharp increase in temperature to 105°C was recorded. After which the temperature dropped to an average of 90°C.
For the initial temperature of the electrolyte T = 90°C in the range of U = 20–280 V (curve 3), a drop in temperature was observed taking into account losses in the pipeline to T = 60–70°C. However, the energy reserve in the form of additional heat of the electrolyte placed in the ED zone shifted the total peak temperature increase to the region of lower voltage. At U = 320 V, the temperature reached a short-term peak value — 158°C. After that, there was a sharp decrease in temperature and a repeated increase to 151°C at U = 480 V.
Study on Electrolyte Temperature after ED. The heat flow from the electrolyte-plasma layer to the electrolyte was estimated taking into account the difference in temperatures obtained at the inlet to the hollow cathode and at the outlet from the ED in the electrolyte collection bath. Temperature measurements were made in the flow of electrolyte running down into the bath. Depending on the flow rate, the runoff occurred in drops or a stream. When filling the receiving bath with electrolyte that had passed through the ED, its temperature was measured. The time for the temperature drop by 1°C for 0.1 kg of electrolyte that had entered the receiving bath was about 60 s. Cooling of the drop or jet during the fall was neglected. The measurement results are shown in Figure 5. With an increase in the voltage of the ED formed by the electrolytic cathode and MA, a smooth increase in the temperature of the spent electrolyte is observed. Up to U = 220 V, a characteristic feature is that the entire family of curves lies in the range of ≤ 10°C. The electrolyte flow rate has an ambiguous effect on the temperature of the electrolyte in the receiving bath. With an increase in the electrolyte flow rate to G = 1.2 g/s, an increase in temperature with a shift to a smaller voltage range is observed. This can be explained by the growth of the number of charged particles under increasing the electrolyte flow rate. With an increase in the electrolyte flow rate to G = 2.37 g/s in the range of U= 200–500 V, a lower temperature is observed, which may indicate a faster passage of electrolyte through the ED, and a lower specific power per unit volume for heating the electrolyte. At the same time, the maximum temperature of the electrolyte collected in the receiving bath for all three electrolyte flow rates does not exceed 55°C.
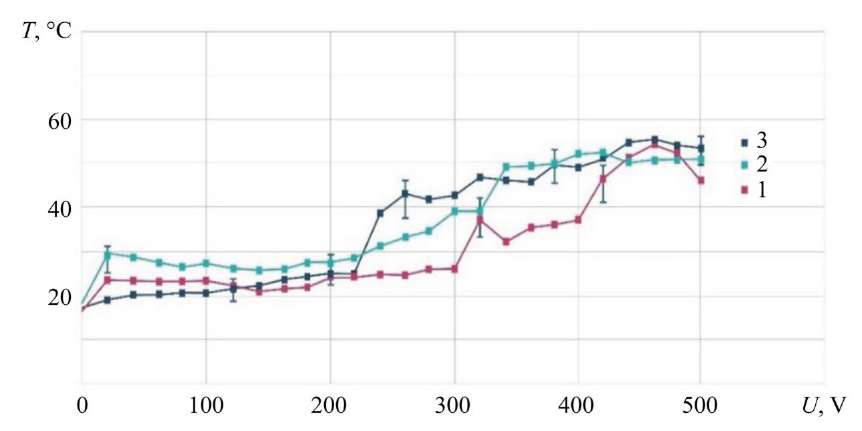
Fig. 5. Dependence of hollow cathode temperature on voltage when using NaCl electrolyte — 4 g/l; MA — KhVG steel; 1 — G = 2.36 g/s; 2 — G = 1.20 g/s, 3 — G = 0.75 g/s
Study on Steam Temperature. To investigate the steam temperature of the ED, the device presented in [13], consisting of a cone made of heat-insulating material, was used. A chromel-alumel thermocouple was installed at the top of the cone. This allowed localizing the evaporated and sprayed electrolyte in a limited volume and measuring its average temperature. The obtained experimental data are presented in Figure 6.
The research has shown that at an electrolyte flow rate of G = 1.2–2.36 g/s up to U = 200 V, the ED vapor temperature differs slightly from room temperature and has a slight increase in the range of 220–300 V. At voltage U = 260–420 V, a sharp increase in the vapor temperature to 67.3°C is observed, proportional to the discharge power between the electrolytic cathode and MA. Then, a slight decrease in the vapor temperature to 56.3º C is seen. After U = 420 V, a drop in the vapor temperature is recorded due to a change in the geometric shape of the electrolyte-plasma discharge.
For low electrolyte flow rates (G = 0.75 g/s and G = 1.2 g/s), a sharp increase in steam temperature to 87.5°C is observed in the range of U = 180–300 V for curves 2 and 3, which have the form of an exponential function. Such a difference in steam temperature may indicate that at G = 2.36 g/s and practically equal discharge power, the volumetric flow rate of electrolyte localized by the electromagnetic field in the ED is 2–3 times greater. Therefore, with an increase in the volumetric flow rate of electrolyte, the power of the electric discharge generated in the electrolyte-plasma layer is not enough to convert part of the liquid into steam.
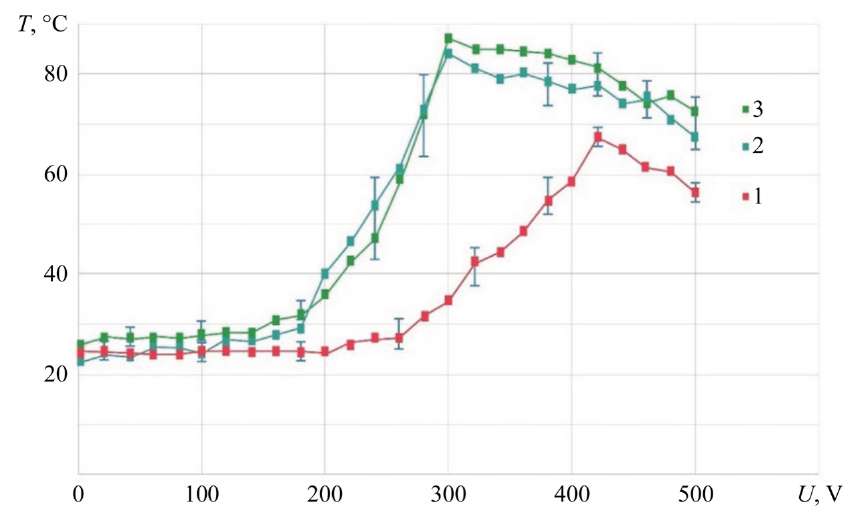
Fig. 6. Dependence of temperature of steam generated by ED on voltage; MA — KhVG steel; NaCl — 4 g/l; 1 — G = 2.36 g/s; 2 — G = 0.75 g/s; 3 — G = 1.20 g/s
Loss of Electrolyte Consumed for Evaporation. The change in the electrolyte volume was recorded after passing 0.1 kg of electrolyte through the hollow cathode during the formation of the ED. The spent electrolyte was collected in the receiving bath and re-weighed. The increase in the ED temperature at G = 2.37 g/s started with U = 220 V and led to an increase in the transfer of electrolyte in the form of vapor into the environment for all the studied flow rates (Fig. 7). At voltage U = 300 V, an increase in the electrolyte consumption for evaporation was recorded only for its small flow rates when passing through the hollow cathode: G = 0.75 g/s and G = 1.20 g/s up to 5.50–5.80 g.
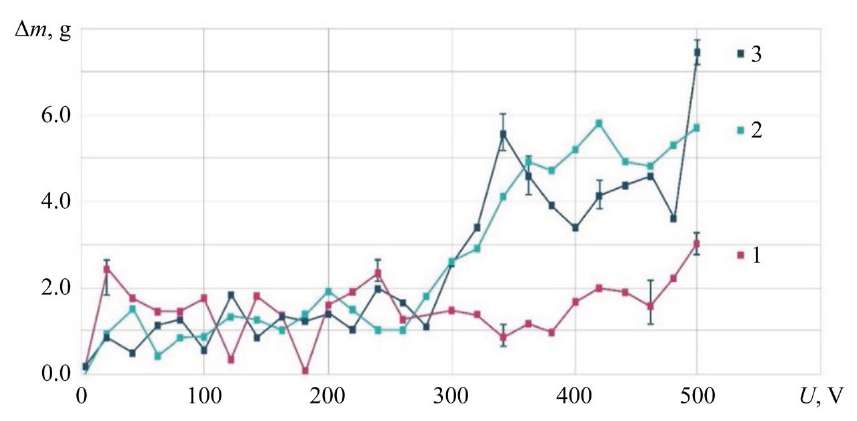
Fig. 7. Dependence of electrolyte mass loss on discharge voltage; NaCl — 4 g/l; MA — KhVG steel; 1 — G = 2.36 g/s; 2 — G = 0.75 g/s; 3 — G = 1.20 g/s
A characteristic increase in the loss of electrolyte mass for G = 0.75 g/s at the point U = 340 V is the zone of formation of an ellipsoid truncated on both sides [9]. After U = 400 V, a decrease in the mass of electrolyte entering the receiving bath is observed for all three curves, which results in an increase in temperature and in electrolyte consumption due to intensive evaporation.
In general, this can be explained by an increase in the heat flow from the electrolyte-plasma layer to the ED zone and growth of its temperature. It should be clarified that the gas-vapor shell of the ED, formed under the action of an electromagnetic field with an increase in voltage, has greater mobility of individual discharge elements — bubbles. Their constant movement around the discharge axis occurs due to the Lorentz forces and the dipole moment. This results in an intensive transfer of molecules from the interface “bubble — environment”. Another factor that makes a significant contribution to the evaporation of the electrolyte is the ionization of bubbles. In [9], it is shown that the ionization of the ED, which is well recorded especially in the upper part of the discharge, starts with the shell of the bubble. With growth of the discharge voltage, there is an increase in the ionization of the components, their surface energy and, consequently, a decrease in the energy of detachment of gas molecules from the surface of the bubbles.
Specificity of Electrolyte Flow Rate. When measuring the flow rate of 0.1 kg of electrolyte through the ED, the authors recorded the following features (Fig. 8). With an increase in voltage between the electrodes, the electrolyte flow rate was not constant and had different values. This was typical for all three studied electrolyte flow rates.
The greatest stability is shown by the mode G = 1.20 g/s (curve 2). However, at voltage U = 340 V, a sharp decrease in the electrolyte flow rate is observed — more than twice as compared to the initial.
At high initial electrolyte speed G = 2.3 g/s, with growth of discharge voltage U = 20–300 V, the flow rate increases. With a further growth of voltage U from 300 to 460 V, a slowdown in the electrolyte flow rate is also recorded. The slowdown in the flow rate can be most clearly seen at G = 0.75 g/s. In this case (curve 3), a clearly defined rise is observed. Here, the electrolyte flow rate decreases by up to two times.
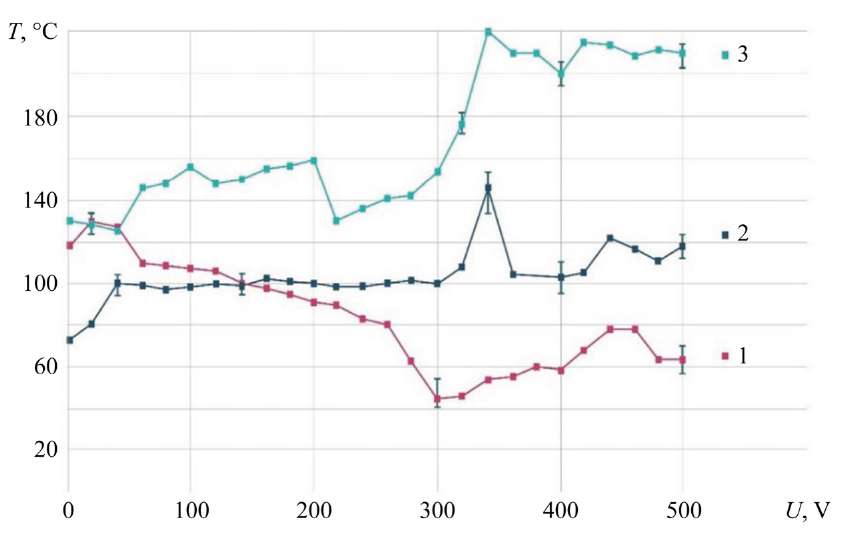
Fig. 8. Dependence of the time of passing 100 g of electrolyte through discharge on voltage; NaCl — 4 g/l; МА — KhVG steel; 1 — G = 2.37 g/s; 2 — G = 1.20 g/s; 3 — G = 0.75 g/s
Measuring ED Temperature Field with Thermal Imager. Measuring the ED zone with a thermal imager showed a temperature increase of up to 100°C. Electrolyte with an initial temperature of 23–26°C was directed to the MA made of 08X18N9T stainless steel with a size of 100x200x1 mm. In this case, the maximum temperature of the ED was recorded.
When studying the electrolyte-plasma discharge at different volumetric flow rates, concentrations and chemical compositions of the electrolyte, it was found that the ED temperature did not exceed 100°C (Fig. 9).
The characteristic features of the process are two key factors. The first is the proximity of the curves, the second is the decrease in temperature after reaching the maximum. The decrease in temperature after reaching the maximum can be explained by a change under the conditions of contact interaction, an increase in specific resistance, and the transition from an electrochemical process to an electrolytic-plasma process.
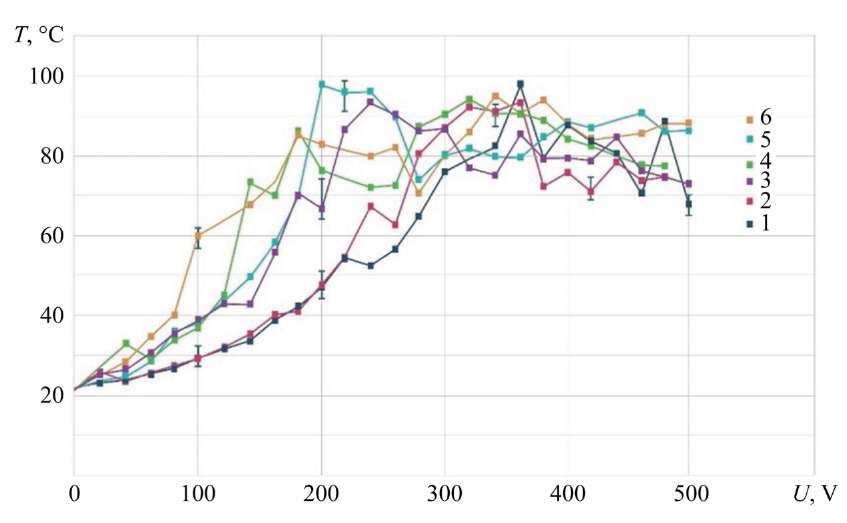
Fig. 9. Dependence of ED temperature on voltage; stainless steel 08X18N9T; 1 — G = 0.94 g/s; 2 — G = 1.86 g/s; 3 — G = 2.78 g/s; 4 — G = 3.71 g/s; electrolyte (NH4)2SO4 — 2.7 g/l; 5 — G = 1.86 g/s; electrolytes (NH4)2SO4 — 50 g/l and C6H8O7 — 30 g/l; 6 — G = 2.51 g/s; electrolytes (NH4)2SO4 — 15 g/l and C6H8O7 — 15 g/l
It is noted that when the falling drops of electrolyte running down from the MA come into contact with the cathode plate fixed below, the maximum temperature is 167°С.
Study on Temperature on Metal Anode Surface. During jet flows of the electric discharge, an uneven temperature distribution is recorded on the surface of the MA. The periphery of the electrolytic discharge in the jet flows has a 15–20% higher temperature than in the central region of the electrolyte. The analysis of temperatures on the surface of the MA is presented in Figure 10.
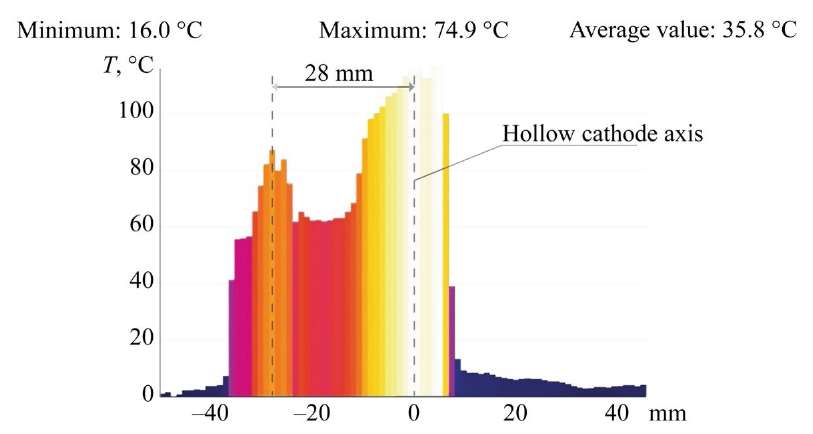
Fig. 10. MA surface temperature; anode — stainless steel 08X18N9T
Evaluation of ED Heat Flows. The analysis of the heat flow distribution shows that it consists of an incoming flow formed by heat generated by the Joule-Lenz law (Q1) and heat generated by the oxidation of carbon in steel (Q2). The outgoing flow consists of heat directed into the environment in the form of steam — Q3; heat directed into the anode — Q4; heat directed into the hollow cathode — Q5; heat directed into the electrolyte — Q6; heat directed into the environment in the form of radiation — Q7. The distribution of heat flows for the ED in the form of an ellipsoid truncated on both sides is shown in Figure 11. The maximum amount of heat Q3 is directed into the environment in the form of steam and is about 58%. The flow Q4 directed into the metal anode is also significant (about 21%).
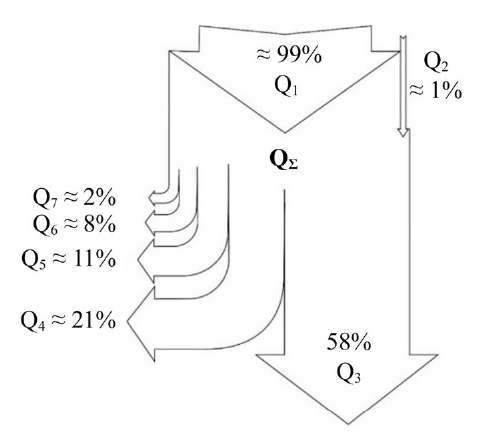
Fig. 11. Distribution of heat flows for an electric discharge in the form of an ellipsoid truncated on both sides
The calculation of the amount of heat for the heat balance equation shows the general picture of the distribution of heat flows in the range of operating voltages from 20 to 500 V (Fig. 12). The calculated curve shows that the amount of heat Q6, directed into the electrolyte, has a virtually constant character over the entire voltage range. At the same time, in the high voltage range, the values of Q1 are almost 20 times higher than Q6. In general, the value of Q6 is on average 10% of the value of Q1.
The calculated value of Q3 in the range up to 260 V exceeds Q1. Obviously, the magnitude of exothermic reactions in this range is not taken into account and makes a significant contribution to the total heat flow. The value of Q3 is on average 50–70% of Q1.
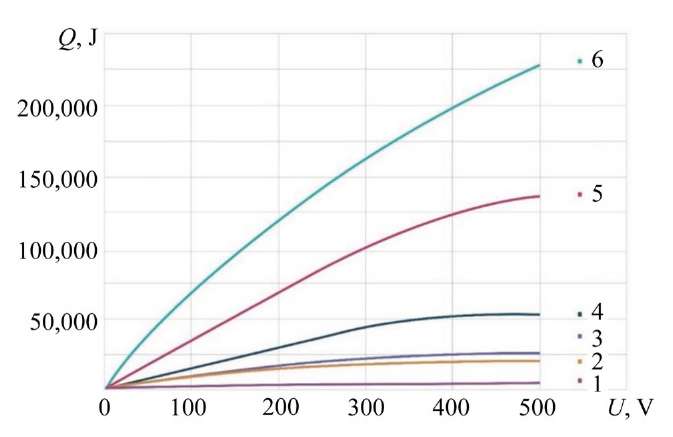
Fig. 12. Ratio of heat flows in the range of operating voltages from 20 to 500 V:
1 — Q7; 2 — Q6; 3 — Q5; 4 — Q4; 5 — Q3; 6 — Q1
Discussion and Conclusion. As a result of the conducted study on the thermal state of the system formed by the electrolytic cathode and the metal anode, it can be confirmed that in the given geometric ratio of the metal anode and the hollow cathode and the studied volumetric flow rates of the electrolyte, the maximum temperatures on the anode do not exceed 100°C, and the maximum temperatures of the system are 167°C.
The results obtained are consistent with the data presented by other researchers and published recently. For example, in the study on plasma electrolytic jet polishing (PEP-Jet) of AISI 316L stainless steel [23], it is noted that the electrolyte temperature in the range of 68–90°C stabilizes the gas-vapor layer, which is consistent with the data obtained by the authors on the process temperatures corresponding to the boiling range of the electrolyte (up to 167°C). However, in [23], the emphasis is placed on corrosion resistance, and not on the complex heat balance, in contrast to the study. The data in [24] indicate that the optimum electrolyte temperature (80°C) provides efficient formation of the gas-vapor layer at voltage 300 V, which is close to the peak temperatures obtained in the ED ellipsoid zone, despite the difference in the research methods used. Paper [25] on the ESR of Inconel 718 alloy simulates the heat flow at the gas-liquid interface at a temperature of 70–85°C and a voltage of 250–350 V, which confirms the above conclusions about the main role of voltage in the formation of the heat flow. However, paper [25] does not consider the nonuniform temperature distribution over the anode surface. In [26], the authors consider ESR of 316L steel at 90°C. They focus on micro-level electrochemical reactions, but they do not analyze the electrohydraulic effect causing cavitation and shock waves, which slows down the electrolyte flow at low flow rates (0.75–1.2 g/s) and increases the temperature. It is a significant factor in the temperature growth at low electrolyte flow rates. This phenomenon is probably associated with the local specificity of the jet discharge, which requires further investigation [27].
The maximum recorded cathode temperature in the study was 167°C, which did not exceed the phase transformation temperature for most structural materials providing their operability. This is consistent with the findings of [24] and [25], which note that the process temperatures also remain below the critical values for the materials. The temperature data measured by various methods confirm that the process occurs in the electrolyte boiling region, which is consistent with the data of [23] and [26] on the temperature ranges of 68–90°C.
Another feature is the uneven distribution of the electrolyte temperature on the MA surface. The value of the electrolyte temperature spreading over the surface is not uniform or decreasing towards the periphery. It is noteworthy that its value falls in the center and increases at the periphery — the peripheral zones are 15-20% hotter than the central ones. A similar phenomenon has not been described by other researchers, since the temperature distribution was either not analyzed or was considered uniform. The cause-and-effect relationship of this effect remains unclear and requires further research. The study on this issue is the subject of subsequent research.
1. Quitzke S, Danilov I, Martin A, Morgenstern R, Lampke Th, Schubert A. Simulation-Assisted Process Design and Experimental Verification of Laterally Confined Oxide Areas Generated with Continuous Electrolytic Free Jet on EN AW-7075 Aluminum Alloy. Micromachines. 2023;14(2):293. https://doi.org/10.3390/mi14020293
2. Bagautdinova LN, Gaisin FM. A Multichannel Discharge in Conducting Liquid at Atmospheric Pressure. High Temperature. 2010;48:126–128. https://doi.org/10.1134/S0018151X10010153
3. Gaisin AlF, Son EE. Vapor-Air Discharges between Jet Electrolytic Cathode and Metal Anode at Low Pressure. High Temperature. 2010;48:447–450. https://doi.org/10.1134/S0018151X10030223
4. Nagulin KYu, Terent’ev AA, Belov MD, Gil’mutdinov AKh. Electrolytic-Plasma Jet Polishing of Additively Manufactured Gas Turbine Engine Components. Russian Aeronautics. 2022;65(4):822–830. https://doi.org/10.3103/S1068799822040237
5. Danilov I, Hackert-Oschätzchen M, Zinecker M, Meichsner G, Edelmann J, Schubert A. Process Understanding of Plasma Electrolytic Polishing through Multiphysics Simulation and Inline Metrology. Micromachines. 2019;10(3):214. https://doi.org/10.3390/mi10030214
6. Gaisin AlF, Gaisin FM, Basyrov RSh, Kayumov RR, Mirkhanov DN, Petryakov SYu. Electrophysical and Thermal Processes under Conditions of Discharge Combustion with a Liquid (Non-Metallic) Cathode. High Temperature. 2023;61(4):484–491. (In Russ.) https://doi.org/10.31857/S004036442304004X
7. Viet D Bui, Martin A, Berger Th, Steinert P, Schubert A. Antibacterial Surface Protection using Electrical Discharge Machining with Zinc Tool Electrode for Medical Devices. Procedia CIRP. 2024;125:278–283. https://doi.org/10.1016/j.procir.2024.08.058
8. Dyakov IG, Belkin VS, Shadrin SYu, Belkin PN. Heat Transfer Peculiarities at Anode Plasma Electrolytic Treatment of Cylindrical Pieces. Electronic Processing of Materials. 2014;50(4):65–75. (In Russ.) URL: https://eom.usm.md/index.php/journal/article/view/eom.2014.50.4.65 (accessed: 10.02.2025)
9. Popov AI, Novikov VI, Radkevich MM. Characteristics of the Development of Electric Discharge between the Jet Electrolyte Cathode and the Metal Anode at Atmospheric Pressure. High Temperature. 2019;57(4):447–458. https://doi.org/10.1134/S0018151X19030118
10. Kulikov IS, Vashchenko SV, Kamenev AYa. Electrolytic-Plasma Processing of Materials. Minsk: Publ. House “Belaruskaya navuka”; 2010. 232 p. (In Russ.)
11. Witzke M, Rumbach P, Go DB, Sankaran RM. Evidence for the Electrolysis of Water by Atmospheric-Pressure Plasmas Formed at the Surface of Aqueous Solutions. Journal of Physics D: Applied Physics. 2013;46:129601. https://doi.org/10.1088/0022-3727/45/44/442001
12. Valentinčič J, Koroth JE, Zeidler H. Advancements in Surface Finish for Additive Manufacturing of Metal Parts: A Comprehensive Review of Plasma Electrolytic Polishing (PEP). Virtual and Physical Prototyping. 2024;19:1–23. https://doi.org/10.1080/17452759.2024.2364222
13. Radkevich MM, Novikov VI, Popov AI, Tyukhtyaev MI. The Analysis of Thermal Phenomena under Jet Focused Electrolytic Plasma Processing. St. Petersburg Polytechnic University Journal: Physics and Mathematics. 2016;254(4):141–150. (In Russ.) https://doi.org/10.5862/JEST.254.15
14. Krevsun EP, Kulikov IS. Device for Electrolytic-Plasma Treatment of Conductive Products.BY Patent No. 16101. 2012. (In Russ.)
15. Slovetskii DI, Terent’ev SD, Plekhanov VG. A Plasma-Electrolyte Metal Heating Mechanism. High Temperature. 1986;24(2):353–363. (In Russ.) URL: https://www.mathnet.ru/rus/tvt4939 (accessed: 03.02.2025).
16. Alekseyev YuG, Korolyov AYu, Parshuto AE, Niss VS. Electrolyte-Plasma Treatment under Non-Stationary Mode in a HighGradient Electric Field. Science & Technique. 2017;16(5):391–399.(In Russ.) https://doi.org/10.21122/2227-1031-2017-16-5-391-399
17. Quitzke S, Kröning O, Safranchik D, Zeidler H, Danilov I, Martin A, et al. Design and Setup of a Jet-Based Technology for Localized Small Scale Plasma Electrolytic Polishing. Journal of Manufacturing Processes. 2022;75:1123–1133. https://doi.org/10.1016/j.jmapro.2022.01.064
18. Danilov I, Paul R, Hackert-Oschätzchen M, Zinecker M, Quitzke S, Schubert A. Random Sequential Simulation of the Resulting Surface Roughness in Plasma Electrolytic Polishing of Stainless Steel. Procedia CIRP. 2020;95:981–986. https://doi.org/10.1016/j.procir.2020.02.255
19. Hackert-Oschätzchen M, Meichsner G, Zinecker M, Martin A, Schubert A. Micro Machining with Continuous Electrolytic Free Jet. Precision Engineering. 2012;36(4):612–619. https://doi.org/10.1016/j.precisioneng.2012.05.003
20. Nestler K, Böttger-Hiller F, Adamitzki W, Glowa G, Zeidler H, Schubert A. Plasma Electrolytic Polishing – An Overview of Applied Technologies and Current Challenges to Extend the Polishable Material Range. Procedia CIRP. 2016;42:503–507. https://doi.org/10.1016/J.PROCIR.2016.02.240
21. Guo QJ, Zhao YJ, Ni GH, Li L, Lin QF, Sui SY, et al. N2/H2 Non-Thermal Transferred Arc Plasma Nitriding Treatment of Stainless Steel at Atmospheric Pressure. Plasma Chemistry and Plasma Processing. 2020;40(6):1525–1537. https://doi.org/10.1007/s11090-020-10103-0
22. Barinov YuA, Shkol’nik SM. Discharge with a Liquid Nonmetallic Cathode (Tap Water) in Atmospheric-Pressure Air Flow. Technical Physics. 2016;86(11):155–158. (In Russ.) https://doi.org/10.21883/jtf.2016.11.43833.1833
23. Ghezri A, Pratama K, Scholl YV, Küenzi AM, Nelis T, Burger J, et al. Energy Efficient Jet Polishing via Electrolytic Plasma Enhances Corrosion Resistance in Stainless Steel. MDPI. 2024;8(6):289. https://doi.org/10.24451/dspace/11365
24. Gangqiang Ji, Longfei Ma, Liyun Wu. Effect of the Gas Layer Evolution on Electrolytic Plasma Polishing of Stainless Steel. Scientific Reports. 2024;14:22099. https://doi.org/10.1038/s41598-024-74263-1
25. Chuanqiang Zhou, Ning Qian, Honghua Su, Zhao Zhang, Wenfeng Ding,Jiu-hua Xu. Effect of Energy Distribution on the Machining Efficiency and Surface Morphology of Inconel 718 Nickel-Based Superalloy Using Plasma Electrolytic Polishing. Surface and Coatings Technology. 2022:441(15):128506. https://doi.org/10.1016/j.surfcoat.2022.128506
26. Gangqiang Ji, Longfei Ma, Sunan Zhang, Juan Zhang, Liyun Wu. Study of Electrochemical Behavior and a Material Removal Mechanism During Electrolytic Plasma Polishing of 316L Stainless Steel. Materials. 2025;18(6):1307. https://doi.org/10.3390/ma18061307
27. Sirota VV, Zaitsev SV, Limarenko MV, Churikov AS, Podgornyi DS. The effect of the introduction of B4C on the adhesive and cohesive properties of self-fluxing coatings. ConstructionMaterialsandProducts. 2024;7(6):5. https://doi.org/10.58224/2618-7183-2024-7-6-5
Alexander I. Popov, Cand.Sci. (Eng.), Associate Professor of the Higher School of Mechanical Engineering
29, Politekhnicheskaya Str., St. Petersburg, 195251
Vitaly I. Novikov, Cand.Sci. (Eng.), Associate Professor of the Higher School of Mechanical Engineering, Peter the Great St. Petersburg Polytechnic University, Associate Professor of the Department of Forensic Science, St. Petersburg State University of Architecture and Civil Engineering
29, Politekhnicheskaya Str., St. Petersburg, 195251,
4, 2nd Krasnoarmeiskaya Str., St. Petersburg, 190005
Dmitry N. Ivanov, Postgraduate Student, Higher School of Mechanical Engineering
29, Politekhnicheskaya Str., St. Petersburg, 195251
Igor A. Kozyrskiy, 4th year student majoring in Mechanical Engineering Technology, Higher School of Mechanical Engineering
29, Politekhnicheskaya Str., St. Petersburg, 195251
Temperature characteristics are studied during electrolytic jet machining. A heat balance equation is developed to describe heat distribution in the system. Significant temperature variations depending on electrolyte flow rate and voltage are found. The results can be used to optimize electrolytic plasma machining technology in various industries.
Popov A.I., Novikov V.I., Ivanov D.N., Kozyrskiy I.A. Analysis of Temperature Characteristics of Electrolytic-Plasma Discharge in Jet Processing of a Metal Anode. Advanced Engineering Research (Rostov-on-Don). 2025;25(2):99-111. https://doi.org/10.23947/2687-1653-2025-25-2-99-111. EDN: DGHAFZ


Advanced Engineering Research (Rostov-on-Don)
ISSN 2687-1653 (Online)
Contact with: Publisher / Editorial Office of the Journal
Publisher: Don State Technical University - DSTU, Rostov-on-Don, Russia - https://donstu.ru/en/
Editor-in-Chief: Alexey N. Beskopylny, Dr.Sci. (Eng.), Professor, Vice-Rector, Don State Technical University (Rostov-on-Don, Russia)
Don State Technical University
1, Gagarin Sq., Rostov-on-Don, 344003, Russia
tel.: +7 (863) 2738-372, e-mail: vestnik@donstu.ru
16+
Processing of personal data