Contents
Scroll to:
https://doi.org/10.23947/2687-1653-2025-25-2-120-128
EDN: QBDMMA
Scroll to:
Introduction. Trade development requires the implementation of artificial intelligence and machine learning technologies to improve the accuracy of delivery forecasts. The scientific research published to date in this area appears insufficient for two reasons. First, it focuses primarily on global supply chains, although the issue is relevant for local businesses as well. Second, forecasting typically requires large amounts of data for machine learning and significant computing resources that are not available to the majority of companies. The presented study aims to fill these gaps and demonstrate the efficiency of using open, accessible data and known algorithms. The research objective is to describe a pattern of appropriate selection of the least resource-intensive delivery forecasting model based on the analysis of machine learning algorithms.
Materials and Methods. The open data set DataCo Smart supply chain for big data analysis on deliveries in online trade was used. To process and analyze the information, methods of data cleaning, eliminating multicollinearity, normalization and coding of categorical features were applied. The following algorithms were used with the cleaned data: Decision tree, Random Forest, k-nearest neighbors, Naïve Bayes, Linear discriminant analysis, XGBoost, CatBoost, LightGBM, AdaBoost, and Perceptron.
Results. The basic algorithm for the delivery forecasting model was the Decision Tree algorithm. This choice was due to its high accuracy, ease of use, and low risk of overfitting. The model evaluation showed a high determination coefficient close to one (0.986). Low values of the mean square error (0.0367) and mean absolute error (0.0324) were recorded. The model showed satisfactory results in terms of time spent on training (3.3087 s) and forecasting (0.0051 s). Actual and predicted values almost perfectly matched. Deviations from actual values were minimal.
Discussion and Conclusion. The proposed model is efficient and has a high predictive ability. High-quality forecasting of delivery time is possible without the use of extensive databases and powerful computing resources. The study opens up the prospect of high-quality organization of logistics operations for small and medium enterprises. In further research, it is advisable to integrate weather data, traffic conditions and other indicators into the model. Using such information in real time will increase the adaptability and accuracy of forecasting.
Rezvanov V.K., Romakina O.M., Zaytseva E.V. Forecasting Delivery Time of Goods in Supply Chains Using Machine Learning Methods. Advanced Engineering Research (Rostov-on-Don). 2025;25(2):120-128. https://doi.org/10.23947/2687-1653-2025-25-2-120-128. EDN: QBDMMA
Introduction. In the context of trade development, the relevance of accurate forecasting of delivery time increases. The inefficiency of traditional planning methods is due to the uncertainty related to the effect of various factors. It is obvious that the use of artificial intelligence (AI) in logistics can significantly improve the accuracy of forecasts and reduce operating costs. According to the international consulting organization McKinsey & Company, enterprises using AI for supply chain management can reduce forecast errors by 20–50%, which ultimately reduces costs by 10–15%1.
Published scientific papers on this topic mainly consider large-scale, global supply chains [1]. Various approaches to forecasting delivery time are actively discussed, but research usually focuses on complex and resource-intensive models that are inaccessible to the majority of enterprises — small and medium-sized ones. At the same time, the problem is indeed a challenge for local, small businesses that are badly in need of saving resources. This is facilitated by better settings of logistics processes in general and, in particular, accurate delivery time forecasting. Companies with limited information and computing capabilities have few tools to improve the situation. The presented study is intended to fill this gap. The research objective is to determine the most efficient and least resource-intensive machine learning model for forecasting delivery time.
Materials and Methods. The study used a structured dataset of sales, deliveries, customers, and financials. The open-source DataCoSupplyChainDataset is hosted by DataCo Global in the free Mendeley Data cloud repository. The basics in this dataset are order and delivery dates, customer information, order financials, and delivery status.
Before analysis and modeling, the data were pre-processed — cleaned and transformed. To achieve the set goal, correlations were first identified and multicollinearity was eliminated on the basis of the correlation matrix (Fig. 1).
![]()
Fig. 1. Correlation matrix
The matrix allowed us to identify several pairs of features with a correlation coefficient equal to 1. This indicates their complete duplication. These pairs of features are presented below.
To eliminate duplication, the following features have been removed:
It was also found that the product_status (product availability) feature has only one unique value (0), i.e., the product is always available. This feature was also removed.
To analyze multicollinearity between numerical features, the variance inflation factor (VIF) was used [2]. Features with VIF higher than 5 indicate a strong relationship with other features, which can distort the results of the analysis and models. To avoid this problem, such features were removed or combined. This reduced data redundancy and increased the stability of the model.
After preliminary processing, we selected the main numerical and categorical features for further analysis and model building.
Numerical features included such indicators as sales, profit, discounts, and quantity of goods in the order. Categorical features included delivery status, customer segment, and delivery mode.
For features with VIF above 5, further analysis was performed to identify redundant relationships. If a feature could be expressed through others, it was replaced by a combination of simpler features. Examples are presented below.
Missing values in the order_zipcode column were replaced with customer_zipcode.
The data in the days_for_shipping_real column was converted to a normal floating-point number.
In the original dataset, the features “delivery status”, “customer segment”, and “delivery mode” were categorical, which made it difficult to use numerical machine learning models. Using the Label Encoder2 method, these features were converted to a numeric format:
The described approach provides preserving the differences between categories, and at the same time using the categories in the machine learning process.
When selecting the optimal machine learning model for predicting delivery time, a number of machine learning algorithms were implemented. Decision tree [3] is one of the most common machine learning algorithms used for tasks related to decision making based on a set of features. Taking into account the values of some features, the algorithm divides the data into smaller subgroups and then structures them in the form of a decision tree.
The algorithm works as follows.
Thus, each node of the tree is a decision point at which the data is divided on the basis of the value of some feature. The branches of the tree correspond to the possible results of such a division.
The key point of the algorithm is the determination of the data partitioning feature at each step.
Preliminary experiments showed that the Gini criterion provided the best accuracy of data partitioning within the framework of the task, therefore it was used in the presented work.
To determine the optimal algorithm, Random Forest [4], K-Nearest Neighbors [5], Naive Bayes [6], Linear Discriminant Analysis [7], XGBoost [8], CatBoost [9], LightGBM [10], AdaBoost [11] and Perceptron [12] were tested on the prepared data set. These algorithms were selected due to their widespread use and proven efficiency in solving forecasting problems. Each model was tested on the same dataset after the same preprocessing procedure. To evaluate the efficiency of the models, the following metrics were used: R² (determination coefficient), mean square error (MSE), mean absolute error (MAE), as well as the time spent on training and forecasting. The listed metrics provide for an objective comparison of the accuracy and resource intensity of the algorithms, and the selection of the optimal model for forecasting delivery time.
Research Results. Figure 2 shows the quality assessment of the models described above using the metrics listed. Decision Tree and Random Forest demonstrated the highest accuracy. However, the simplicity and interpretability of Decision Tree, as well as its lower tendency to overfitting [13] compared to more complex models, should be taken into account. In this regard, the Decision Tree algorithm was used to predict the delivery time of goods.
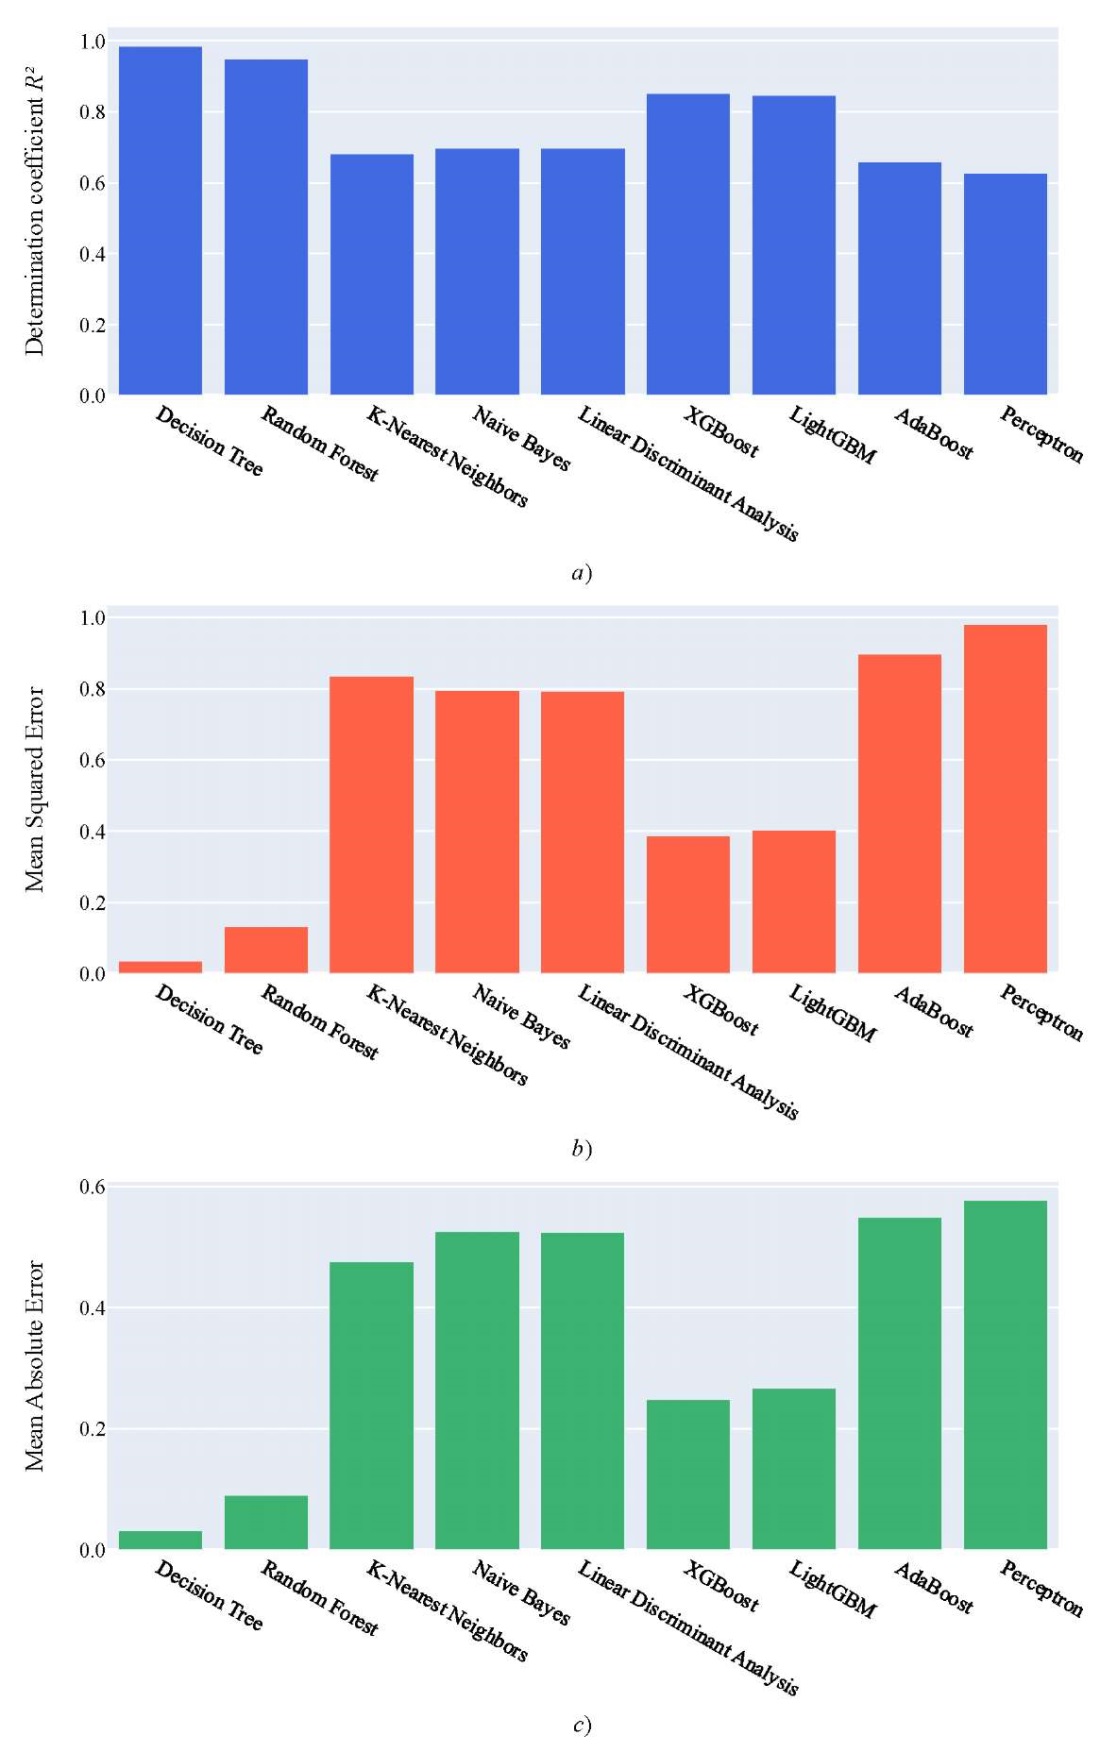
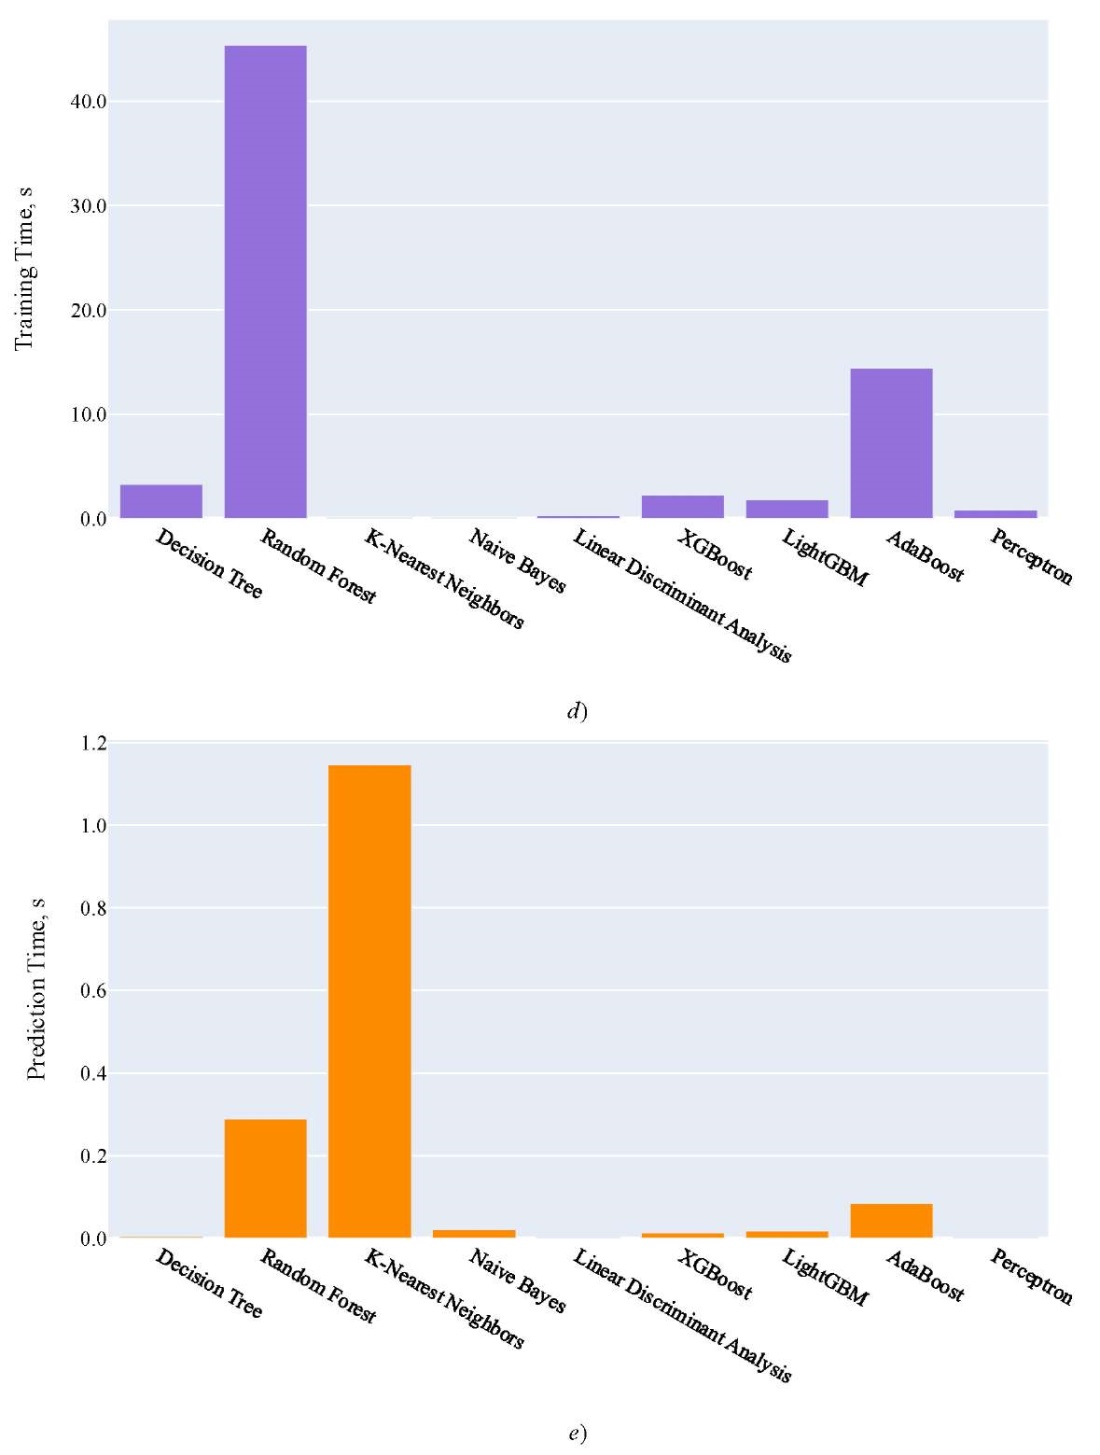
Fig. 2. Model quality assessment:
a — model quality assessment using R² metric;
b — model quality assessment using MSE metric;
c — model quality assessment using MAE metric;
d — training time, s; e — prediction time, s
Thus, testing the Decision tree model gave the following results:
High R² value and low MSE and MAE values indicate high accuracy and efficiency of the model.
Consider the agreement between the actual values and the values predicted by the model (Fig. 3).
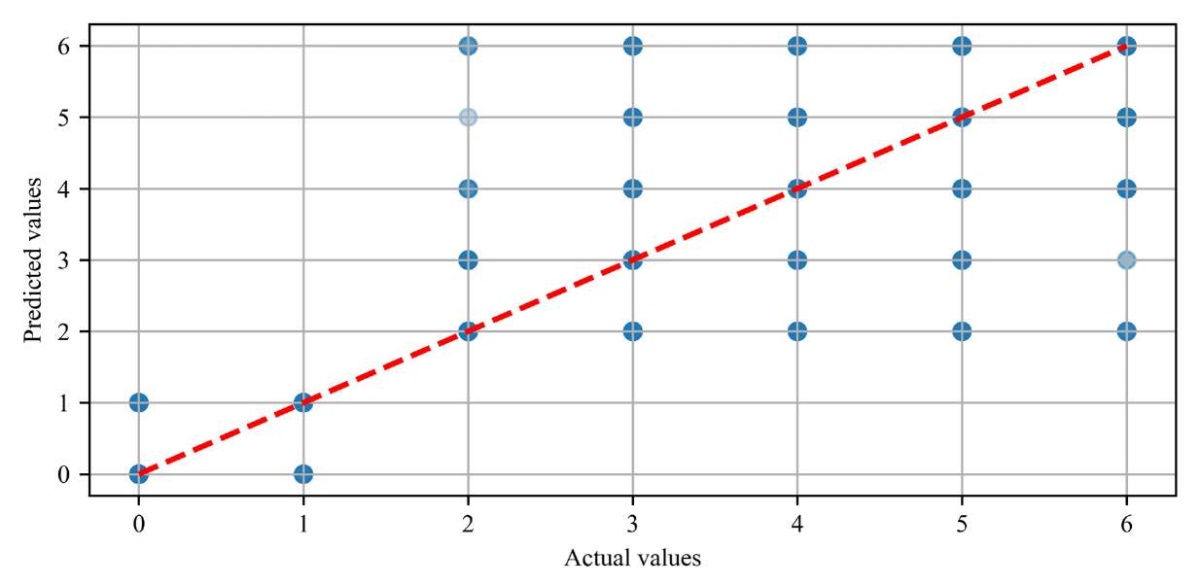
Fig. 3. Actual vs. predicted values chart
As you can see, the blue dots (predicted values) are located close to the red dashed line, which is the line of perfect agreement between the actual and predicted values. This indicates high accuracy of the prediction of values. This indicates high accuracy of the prediction of values.
The dense arrangement of dots along the dashed line refers to the absence of significant biases towards overestimation or underestimation of indicators. This shows a balance between the predicted and actual values.
The clustering of points along the diagonal suggests that deviations from the actual values are minimal. Thus, we can reasonably speak of extremely minor errors and high predictive ability of the model.
Discussion and Conclusion. The experimental results have shown that the decision tree-based model is capable of predicting the delivery time of goods with high accuracy. This is confirmed by high R² values and low MSE and MAE values. It was also established that the model was trained and made a forecast quite quickly, i.e., it was well suited for use under real conditions. In this sense, it is especially valuable that the operations have been implemented with minimal computational resources.
Let us note the basic conditions for achieving good results:
The scientific significance of the presented research should be considered from both theoretical and applied perspectives. In the first case, we are talking about the possibility of successful application of simple and effective machine learning models in logistics. It is shown that these models can provide the required accuracy of forecasts, significantly reduce operating costs, and optimize enterprise resources. The authors of the presented paper select from nine algorithms, each of which may be optimal for solving one or another logistical (or, more broadly, economic) problem of the enterprise. We will list only some of the logistical problems that can be attempted to be solved using the approach described in this paper:
This leads to the second — applied — potential of the scientific research described in the article. The expected final practical effect is better controllability and profitability of logistics. This is especially important for small and medium businesses. Large corporations employ their own staff of analysts and programmers, create their own databases or purchase exclusive information to build effective logistics. Small companies can use the data sets and known algorithms they have accumulated in the course of their work for the same purposes. However, we note that the proposed approach can also be used as a basic model for more complex supply chain management systems.
Further research could focus on integrating additional data sources, such as current traffic conditions, weather conditions, and macroeconomic indicators. Using this information in real time could improve the forecast accuracy and adaptability of models.
1. DocShipper Group. How AI is Changing Logistics & Supply Chain in 2025? URL: https://docshipper.com/logistics/ai-changing-logistics-supply-chain-2025/ (accessed: 22.03.2025).
2. Label Incoder: the method transforms data representing categorical values into integers 0, 1, 2, etc., corresponding to each category.
1. Korchagina E, Korchagina D, Romakina O, Arsenieva A. Application of Artificial Intelligence Technologies in Logistics and Global Supply Chain Management: Analysis of Foreign Scientific Publications. RISK: Resources, Information, Supply, Competition. 2024;(1):29–33. https://doi.org/10.56584/1560-8816-2024-1-29-33
2. Midi H, Bagheri A. Robust Estimations as a Remedy for Multicollinearity Caused by Multiple High Leverage Points. Journal of Mathematics and Statistics. 2009;5(4):311–318. https://doi.org/10.3844/JMSSP.2009.311.321
3. Patel HН, Prajapati P. Study and Analysis of Decision Tree Based Classification Algorithms. International Journal of Computer Sciences and Engineering. 2018;6(10):74–78. https://doi.org/10.26438/ijcse/v6i10.7478
4. Louppe G. Understanding Random Forests: From Theory to Practice. PhD diss. Liège: University of Liège; 2014. 213 p. https://doi.org/doi:10.13140/2.1.1570.5928
5. Zhongheng Zhang. Introduction to Machine Learning: k-Nearest Neighbors. Annals of Translational Medicine. 2016;4(11):218–218. https://doi.org/10.21037/atm.2016.03.37
6. Taheri S, Mammadov M. Learning the Naive Bayes Classifier with Optimization Models. International Journal of Applied Mathematics and Computer Science. 2013;23(4):727–739. https://doi.org/10.2478/amcs-2013-0059
7. Jianhang Zhou, Qi Zhang, Shaoning Zeng, Bob Zhang, Leyuan Fang. Latent Linear Discriminant Analysis for Feature Extraction via Isometric Structural Learning. Pattern Recognition. 2023;149:110218. https://doi.org/10.1016/j.patcog.2023.110218
8. Tianqi Chen, Carlos Guestrin. XGBoost: A Scalable Tree Boosting System. In: Proc. 22nd ACM SIGKDD International Conference on Knowledge Discovery and Data Mining. San Francisco: ACM; 2016. P. 785–794. https://doi.org/10.1145/2939672.2939785
9. Prokhorenkova L, Gusev G, Vorobev A, Dorogush A, Gulin A. CatBoost: Unbiased Boosting with Categorical Features. Advances in Neural Information Processing Systems. 2018;31:6638–6648. https://doi.org/10.48550/arXiv.1706.09516
10. Guolin Ke, Qi Meng, Thomas Finley, Taifeng Wang, Wei Chen, Weidong Ma, et al. LightGBM: A Highly Efficient Gradient Boosting Decision Tree. In: Proc. 31st International Conference on Neural Information Processing Systems (NeurIPS). Long Beach, CA: Curran Associates Inc.; 2017. P. 3149–3157. URL: https://www.researchgate.net/publication/378480234_LightGBM_A_Highly_Efficient_Gradient_Boosting_Decision_Tree (accessed: 22.02.2025).
11. Jianghua Duan, Hongfei Ye, Hongyu Zhao, Zhiqiang Li. Deep Cascade AdaBoost with Unsupervised Clustering in Autonomous Vehicles. Electronics. 2023;12(1):44. https://doi.org/10.3390/electronics12010044
12. Ke-Lin Du, Chi-Sing Leung, Wai Ho Mow, MNS Swamy. Perceptron: Learning, Generalization, Model Selection, Fault Tolerance, and Role in the Deep Learning Era. Mathematics. 2022;10(24):4730. https://doi.org/10.3390/math10244730
13. Zadvornaya IA, Romakina OM. Application of the Algorithm “Decision Trees” to Analysis of Personal Information of Potential Bank Clients. Cloud of Science. 2019;6(3):415–424.129
Vladislav K. Rezvanov, graduate student of the Applied Computer Science Faculty
49, Kronverksky Ave., St. Petersburg, 197101
Oksana M. Romakina, Cand.Sci. (Phys.-Math.), Associate Professor of the Applied Computer Science Faculty
49, Kronverksky Ave., St. Petersburg, 197101
Ekaterina V. Zaytseva, Cand.Sci. (Eng.), Associate Professor of the Computer Science and Computer Technology Department
2, 21st Line, St. Petersburg, 199106
An investigation of the application of machine learning algorithms for predicting delivery times in logistics is presented in the paper. The decision tree method provides high accuracy of predictions with a determination coefficient of 0.986. It turns out to be the least resource-intensive. The application of the proposed algorithm will allow small and medium enterprises to optimize their logistics operations with minimal computational resources. The obtained results open up new opportunities for improving supply chain management using simple machine learning models.
Rezvanov V.K., Romakina O.M., Zaytseva E.V. Forecasting Delivery Time of Goods in Supply Chains Using Machine Learning Methods. Advanced Engineering Research (Rostov-on-Don). 2025;25(2):120-128. https://doi.org/10.23947/2687-1653-2025-25-2-120-128. EDN: QBDMMA


Advanced Engineering Research (Rostov-on-Don)
ISSN 2687-1653 (Online)
Contact with: Publisher / Editorial Office of the Journal
Publisher: Don State Technical University - DSTU, Rostov-on-Don, Russia - https://donstu.ru/en/
Editor-in-Chief: Alexey N. Beskopylny, Dr.Sci. (Eng.), Professor, Vice-Rector, Don State Technical University (Rostov-on-Don, Russia)
Don State Technical University
1, Gagarin Sq., Rostov-on-Don, 344003, Russia
tel.: +7 (863) 2738-372, e-mail: vestnik@donstu.ru
16+
Processing of personal data